Grow profit per route by 15–40% with the team you already have.
We don't just optimize tomorrow's drive. We rebuild how your routes are planned, so they run leaner for years.
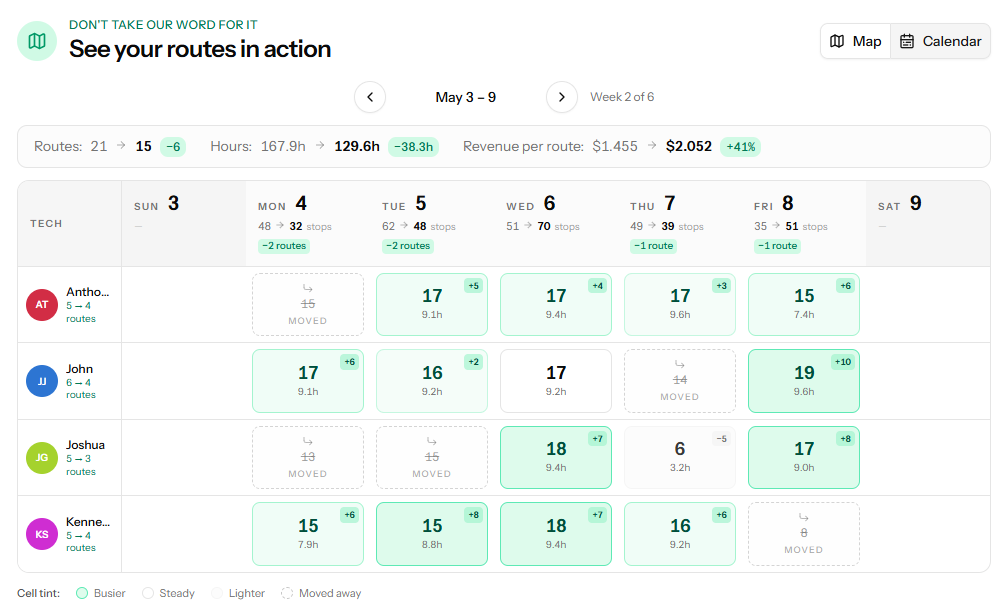
Leaner year after year — same team, same tools.
Territory restructure
Same team. Tighter territories. Fewer miles.
We don't reshuffle tomorrow's drive — we rebuild the map. Scattered stops collapse into tight territories, cross-zone drives disappear, and drive-time share drops for good.
Stops per route
More stops packed into every route the team runs
Labour cost
Same visits, fewer routes to pay for
Drive time
Less of the day spent behind the wheel
Rolled out gradually over a month — no overnight swap, no schedule shock.
Scenario planning
Model the move before you commit to it.
Drop a truck, add a tech, re-zone a territory — PestRouting rebuilds the whole route book for that scenario and sets it beside today's plan. For example: what running one fewer technician would have done.
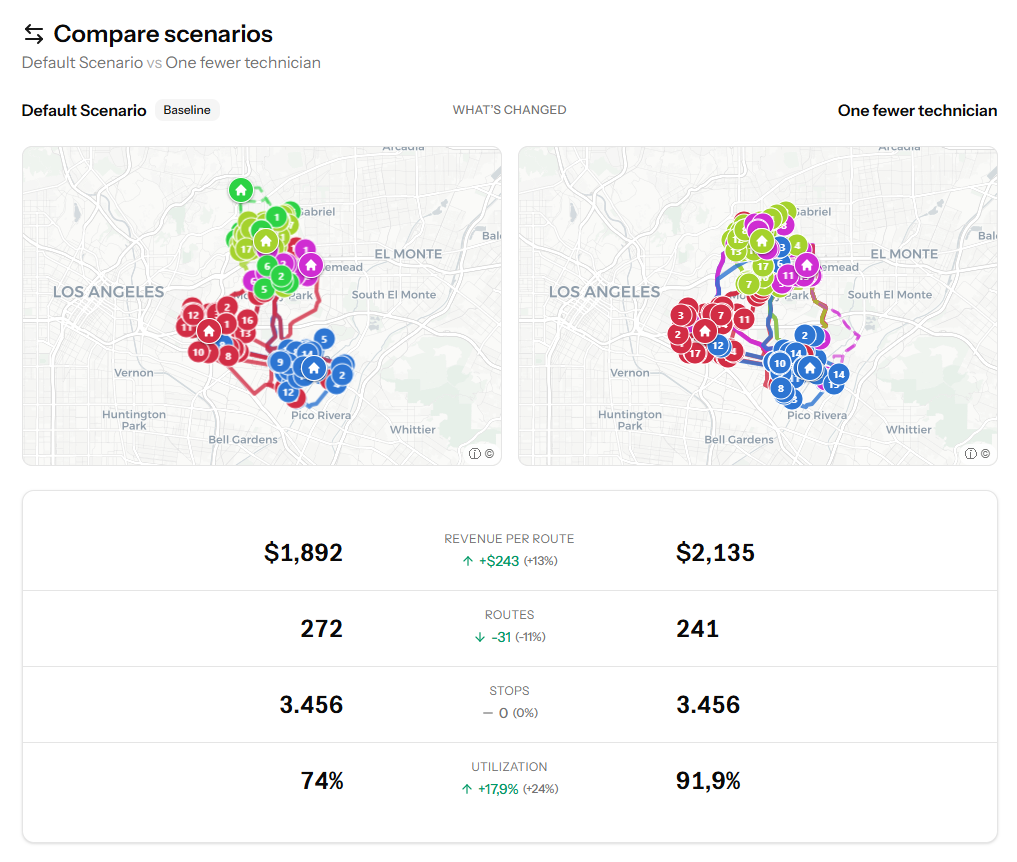
Revenue per route ↑
Each route carries more value
Utilization ↑
Crews run fuller days
Routes & cost ↓
Fewer routes to staff and run
Visits held
Same customers served
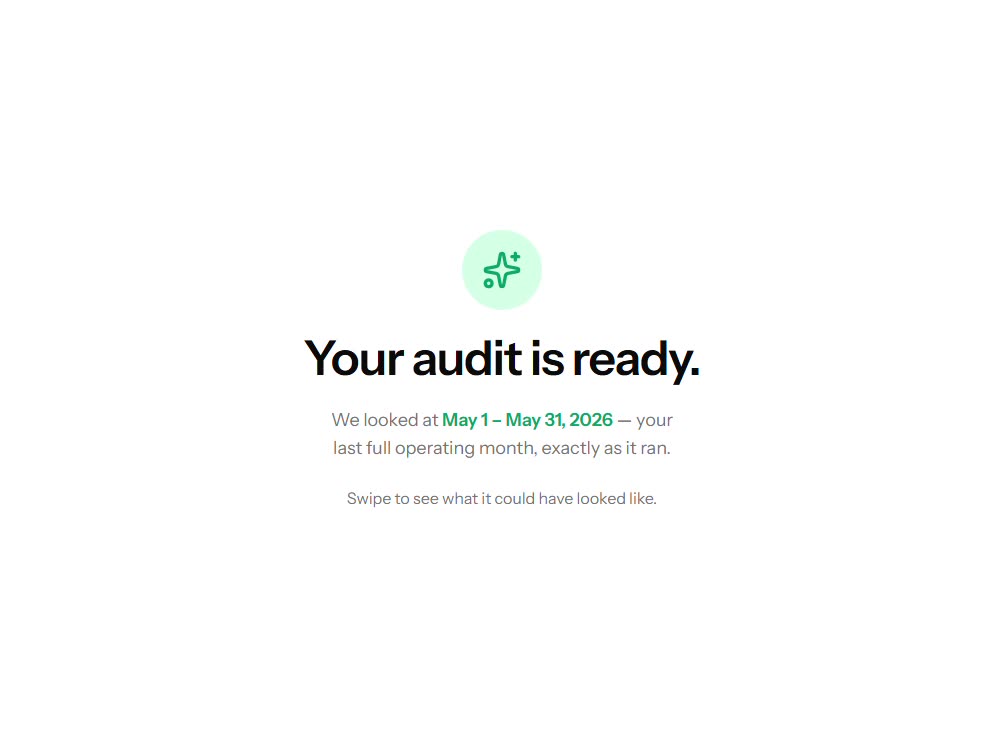
The audit is the pitch
We would rather show you than tell you.
Here is a real one — a single operating month, rebuilt from live FieldRoutes data and replayed end to end. Every Free Route Audit ends in a written report with one clear next step.
- Your real operating month
Rebuilt from your FieldRoutes data, exactly as it ran
- Labour cost cut
The same visits delivered on fewer routes and fewer miles
- Annualized impact
What the structural monthly saving compounds to over a year
- Revenue per route
More value out of every route your team already runs
- Capacity freed
Paid hours handed back — grow without adding a shift
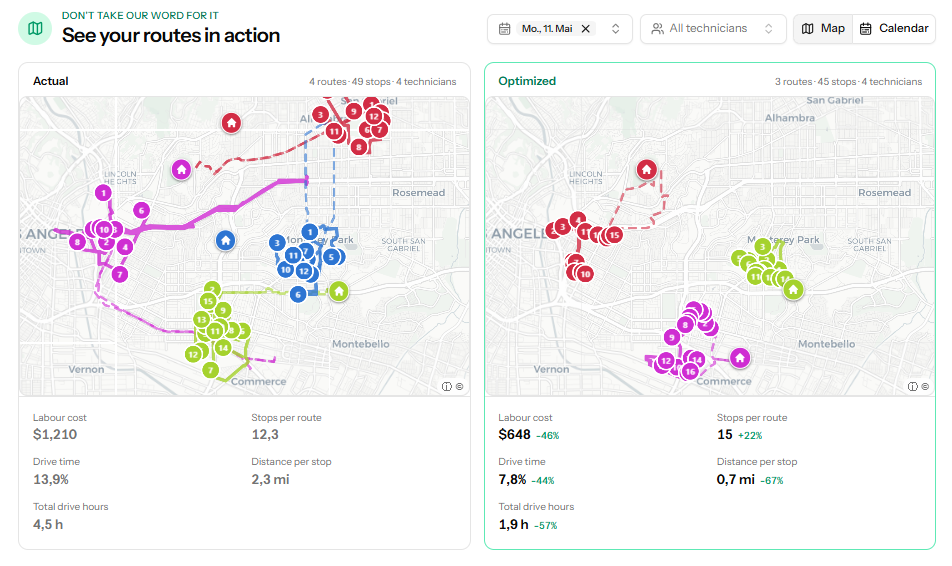
- Actual vs. optimized, visualized
Side by side on the map and the week-by-week calendar
One real operating month, rebuilt and replayed — the same walkthrough we run on your numbers.
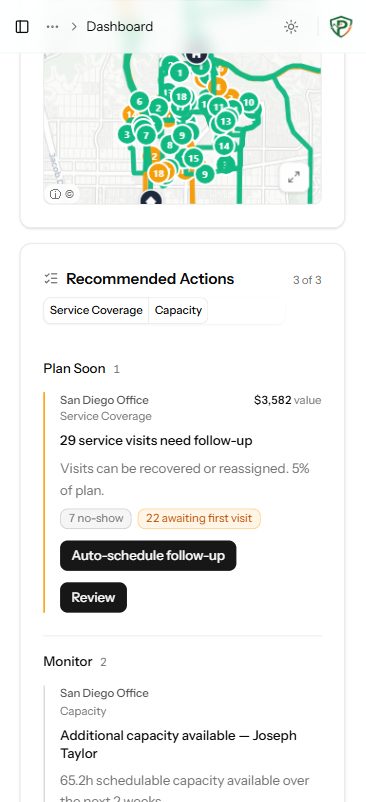
Smart analytics
It doesn't just report. It tells you what to do.
PestRouting watches every route against its plan and turns the drift into a ranked list of moves — each one with the specific fix and the capacity or revenue it frees up. Surfaced from your FieldRoutes data, not a spreadsheet you have to build.
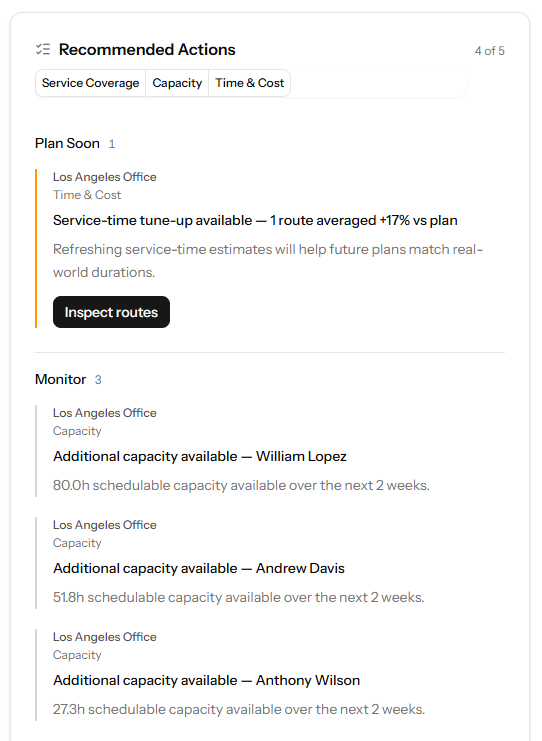
Sees what is happening
Revenue, route cost, and spare capacity tracked against plan
Ranks what matters
Sorted into act-next, plan-soon, and monitor — by impact
Names the specific fix
Service-time tune-ups, spare hours by tech, visits to recover
One click to act
Inspect the routes or auto-schedule the follow-up
The same intelligence behind your Free Route Audit — running continuously once you're live.
The numbers behind it
Every route, measured against its plan.
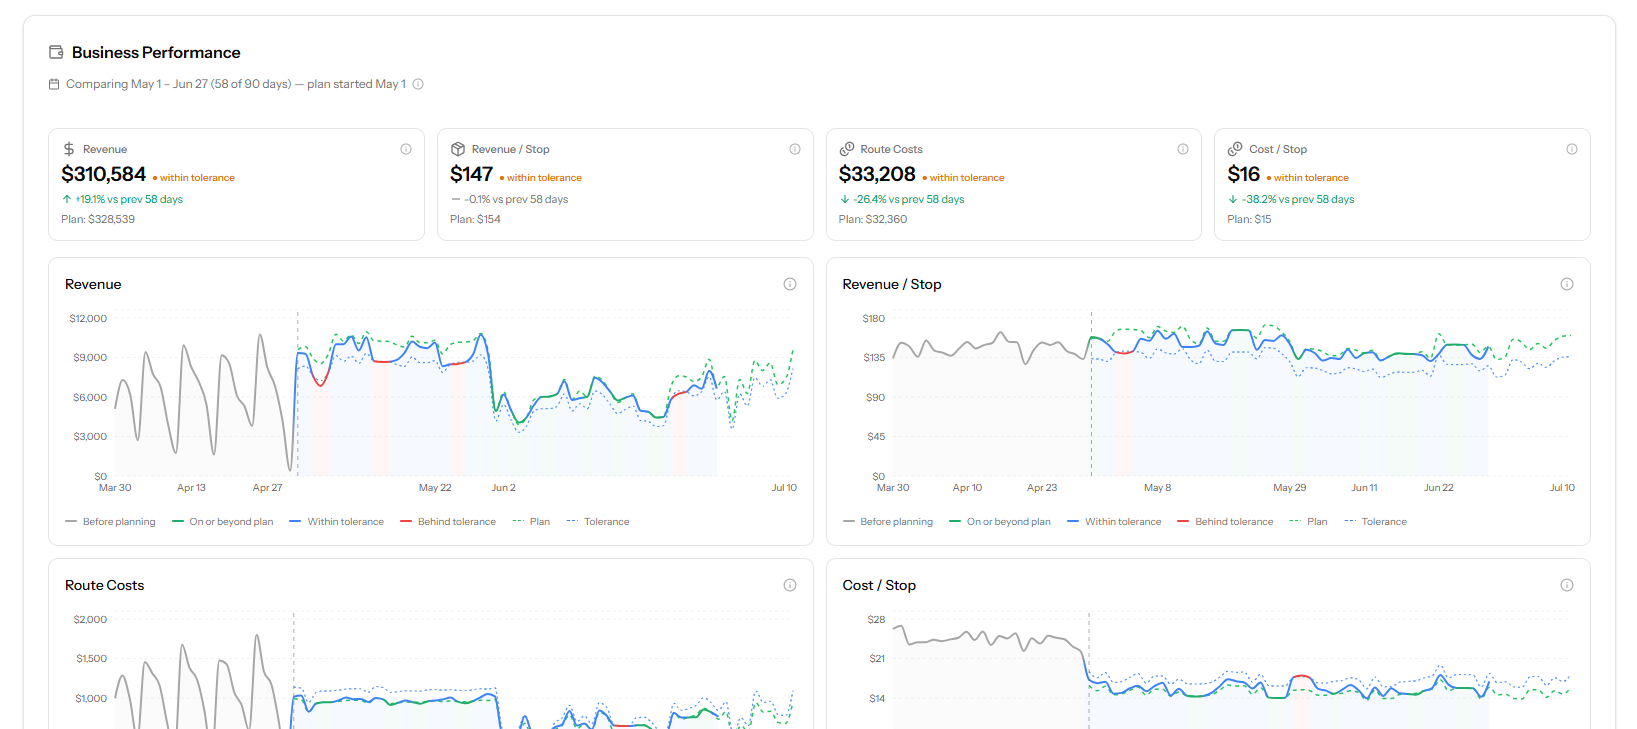
Revenue, route cost, and cost per stop — measured against the plan every day, so drift shows up before it costs you.
Integration · not replacement
FieldRoutes runs the business. PestRouting plans the routes.
We don't replace FieldRoutes. We sit on top of it as a strategic planning layer — and write the optimized route book straight back.
PestRouting
Strategic planning layer
Monthly Route Books
Recurring structure across techs & zones
What-If Simulations
Re-zone vs. hire, modeled side by side
KPI Analytics
Mileage, capacity, route adherence
FieldRoutes
Operations platform of record
Customers & technicians
Daily scheduling
Billing & service history
Your data moves over an encrypted FieldRoutes API connection, stays in your account, and is never sold. See how we handle your data

Your Route Success Manager
Saged A.
Human + Platform
Software finds the route. A planner makes the call.
Expert support comes with every PestRouting account. Step up to a managed plan and a dedicated Route Success Manager works alongside you — someone who knows your route book, your capacity, and what you're planning three months out.
Monthly route review
A working session every month to look at drift, capacity, and what to plan next.
What-if planning session
Re-zone, hire, or rebalance — modeled together before anything is committed.
Quarterly strategy
Route book outlook 3–12 months ahead, aligned to growth, campaigns, and hiring.
Monthly reviews, planning sessions, and quarterly strategy come with a dedicated Route Success Manager on managed plans.
How the planner works with your teamWhat this looks like in production
Built for FieldRoutes operations in all 50 states.
−23%
Mileage
+49%
Production
50
States supported
1
FieldRoutes integration
Representative outcome from a live multi-technician operation — same team, same trucks, rebuilt routes.
Want to see this on your FieldRoutes data?
30-minute intro call. We pull your route book, run the audit, and send a written report back. That's it.
The audit is the pitch. We would rather show you than tell you.
Get Your Free Route Audit
A 30-minute intro call, a written report on what your routes are leaving on the table, and zero pressure to sign anything. We only follow up if you ask.
Book Your Free Analysis
Free analysis with no obligation
We'll analyze your current routes and show you the savings potential.
First call within 24–48 hours
Full analysis and written report typically ready within about a week.
Dedicated Route Success Manager
A routing specialist works your operation — not a ticket queue.
Risk-Free Opportunity
See exactly how much you could save before spending a dime.