Simulations & scenarios
Is the next technician worth it? Where do you split?
A simulation freezes one office’s technicians and customers so every idea you try starts from the same place. Then you run the expensive questions against your own data instead of your instinct.
The baseline
Freeze the office, so the comparison is honest.
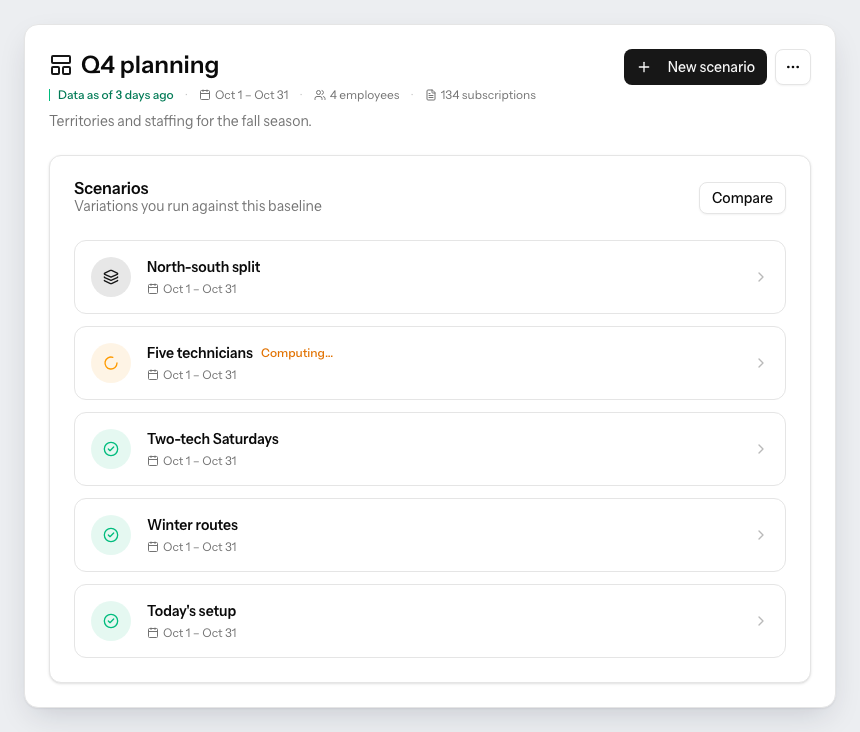
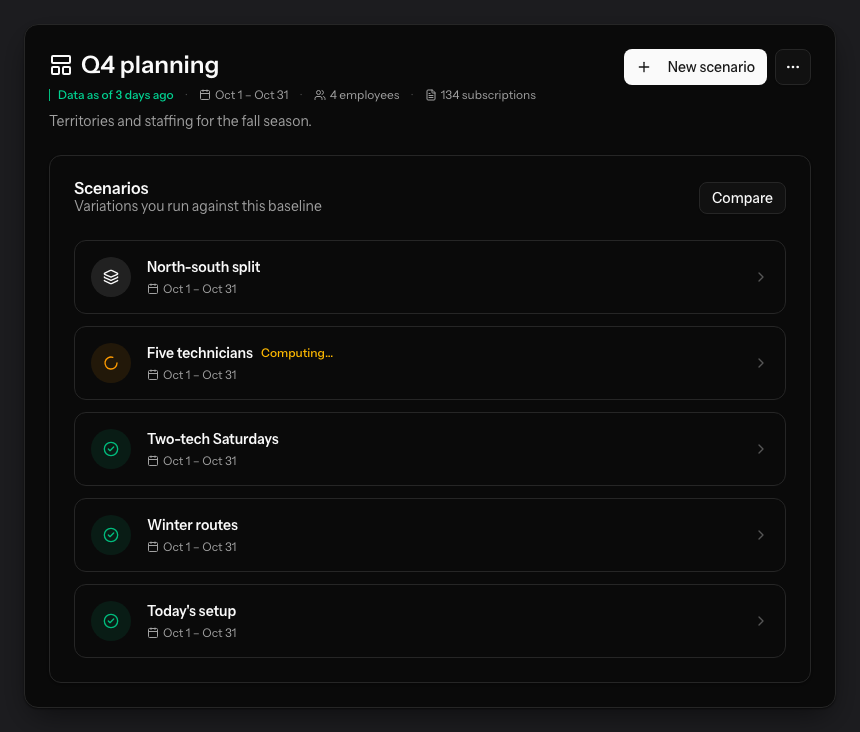
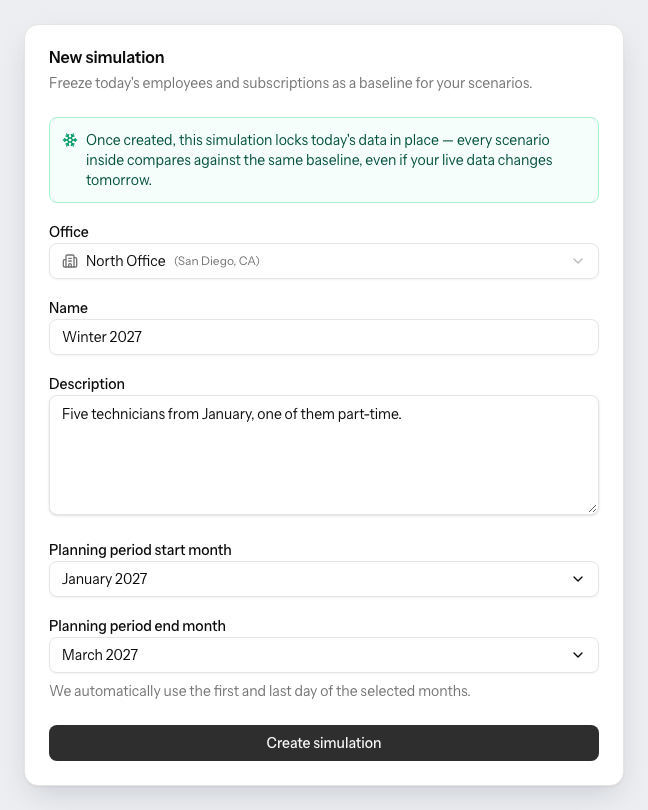
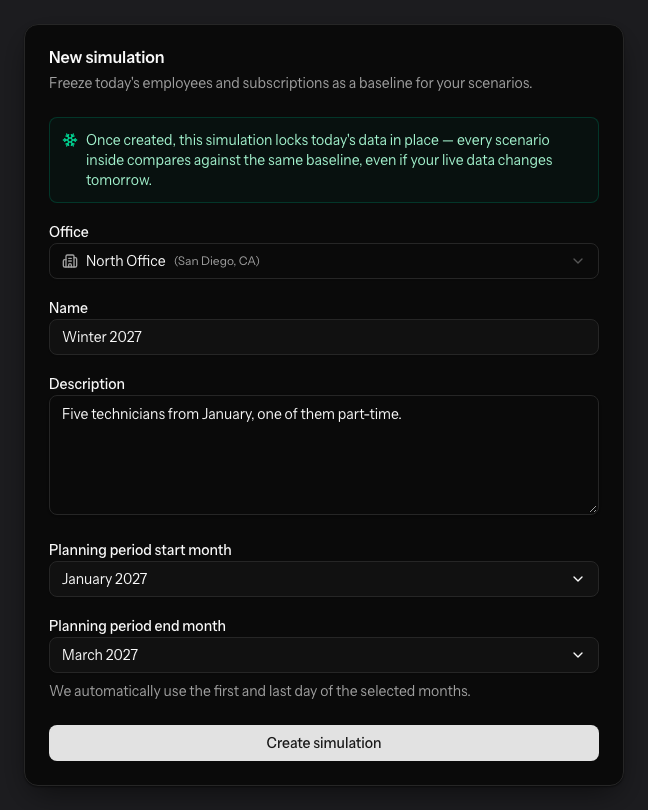
A simulation captures one office’s technicians and subscriptions for a planning period and holds them still. Every scenario inside it starts from that same snapshot, so a difference you see is the change you made — not a customer who cancelled while you were thinking.
- Pick the office and the months the scenarios will plan
- Up to 12 months ahead, depending on your plan
- “Data as of” on every simulation, so you know how fresh it is
- Nothing in your live schedule is touched
Scenarios
Change almost anything, then run it.
Add a technician who does not exist yet, take one out, move a customer’s preferred technician, redraw a territory or change a service frequency. The scenario plans the whole period with that change in place and shows you the month it would produce.
- Add or remove technicians and change who serves whom
- Re-zone territories or change recurrence
- Optionally let it move a recurring visit’s regular day
- Duplicate a scenario to branch instead of starting over
Compare
Two or three ideas, side by side, against today.
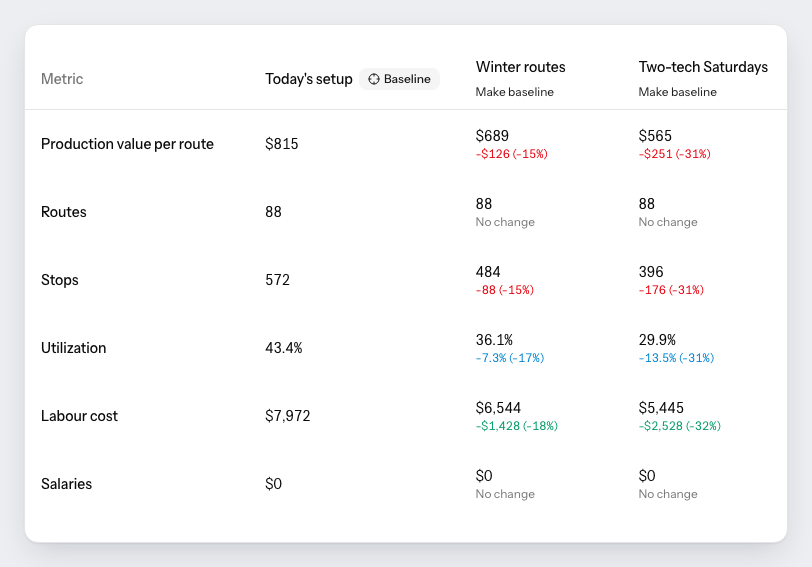
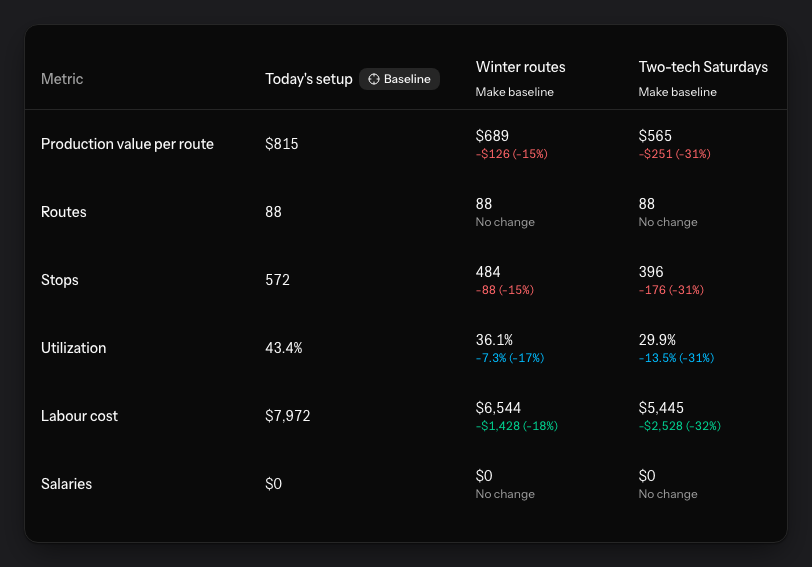
Pick a baseline — usually your current setup — and put the scenarios next to it. Production value per route, routes, stops, utilization and labour cost, with the change under each figure, so the trade-off stops being an argument and becomes a number.
- Any solved scenario can be made the baseline
- Production per route, stops, utilization, labour cost
- What is different about the premise, listed per customer
- Maps of both plans, side by side
Why the number moved
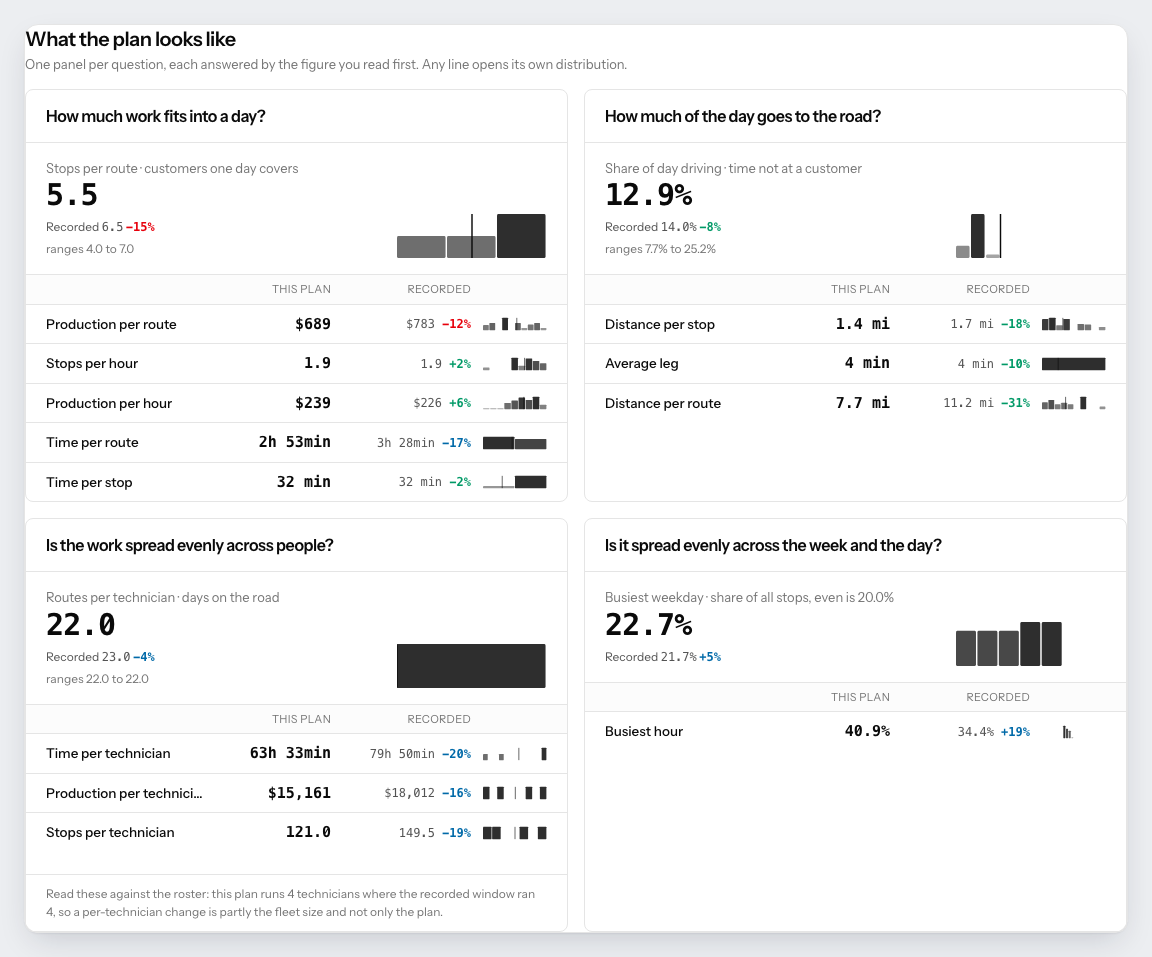
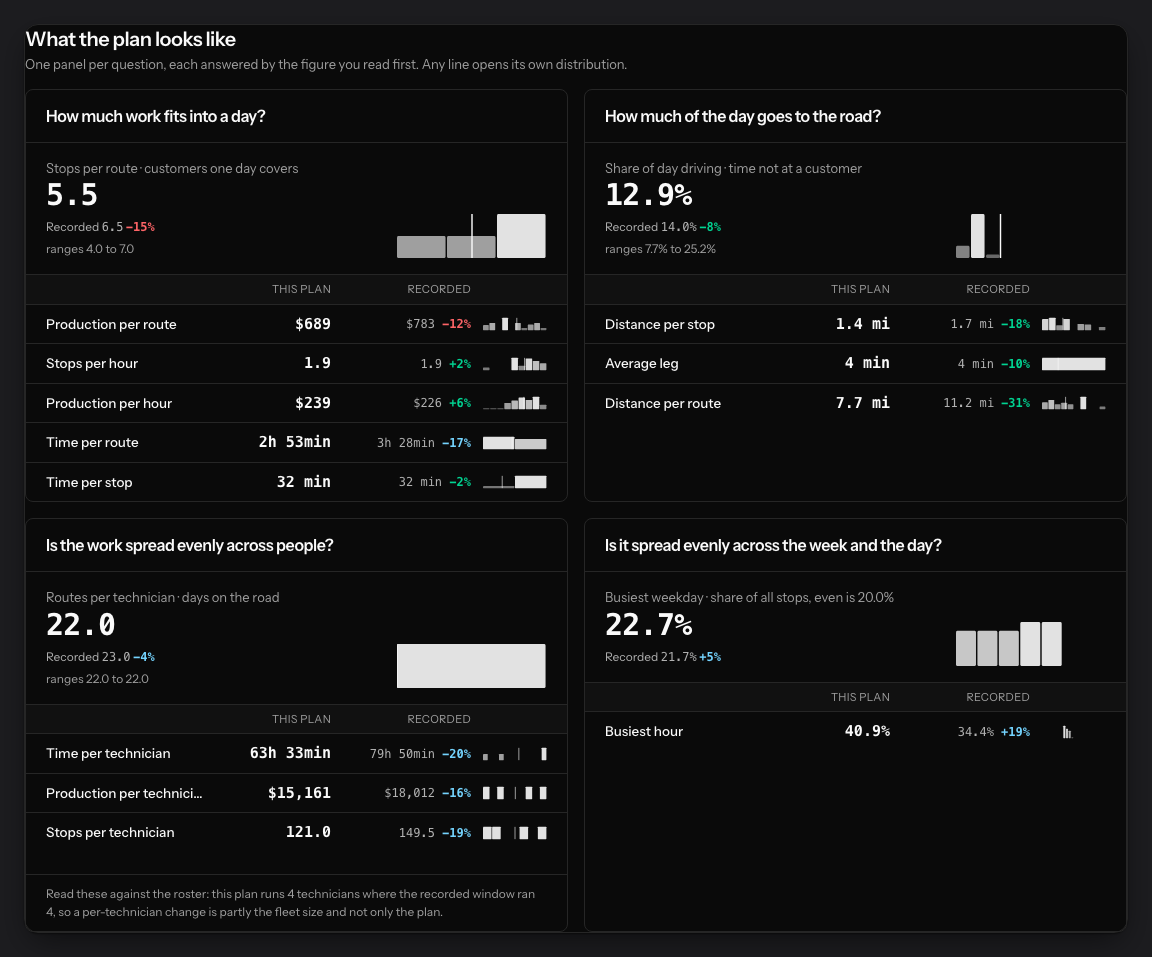
Four questions, answered by the plan itself.
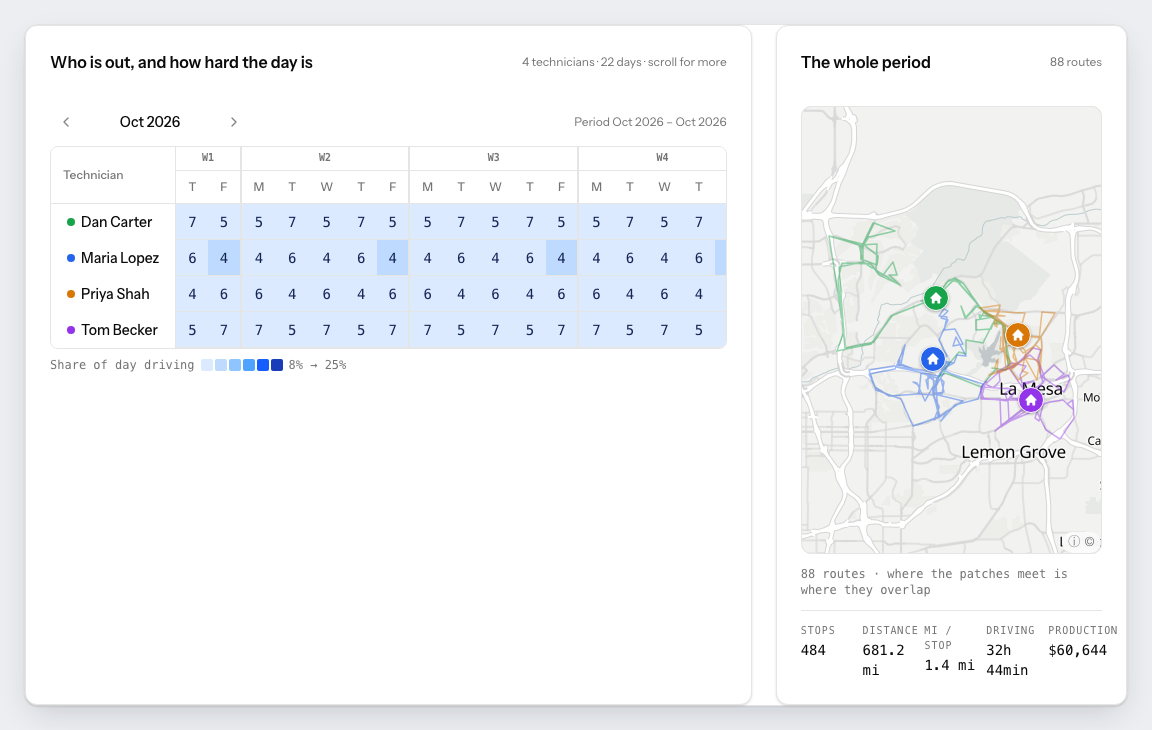
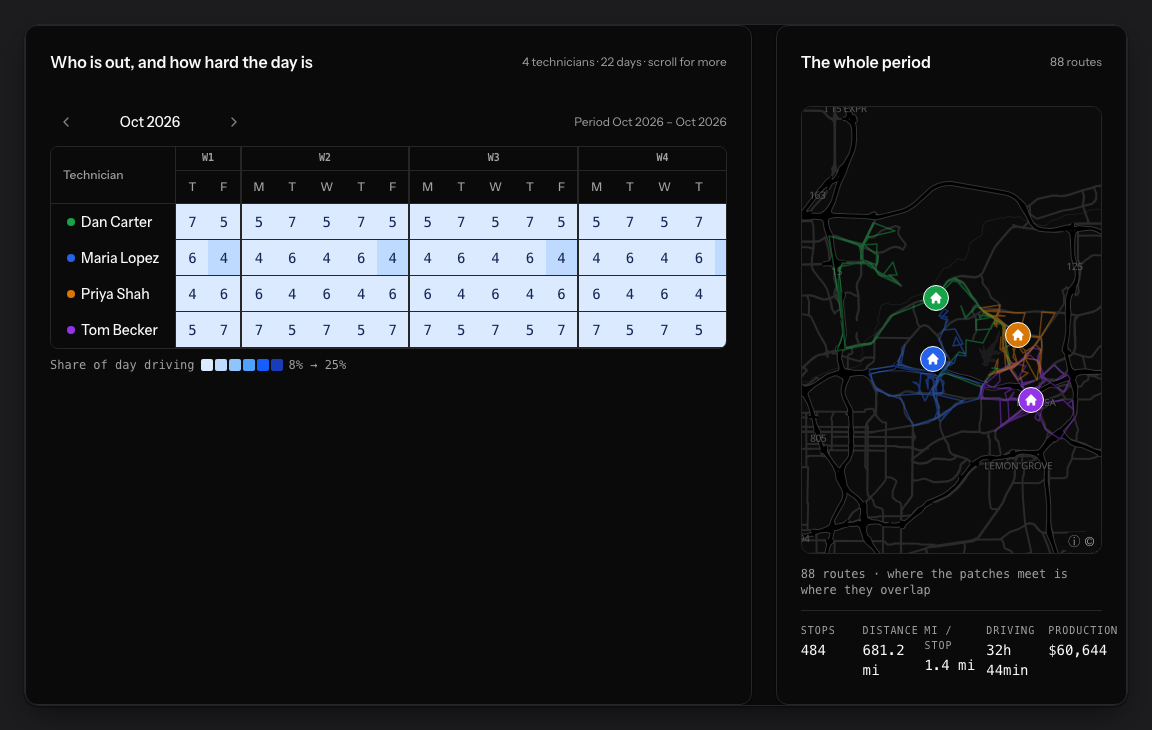
How much work fits into a day, how much of the day goes to the road, whether it is spread evenly across people, and whether it is spread evenly across the week. Each figure opens into the routes behind it, so a bad average has an address.
- Stops, production and time per route and per hour
- Share of the day driving, distance per stop, average leg
- Routes, time and production per technician
- Busiest weekday and busiest hour against an even share
Adopt it, or do not
A scenario can become the real thing. Once.
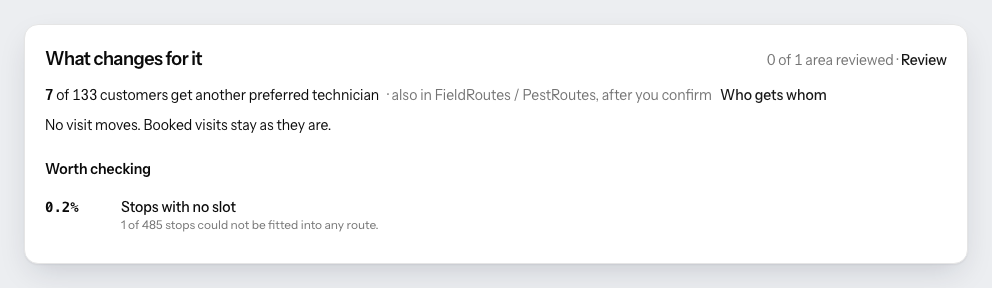
When one wins, adopting it writes its changes into your data — a new preferred technician for seven customers, say — and lists exactly which ones. Those changes then reach FieldRoutes only through a write-back batch somebody confirms.
- Every change listed before anything is written
- What goes to FieldRoutes is named separately
- Booked visits stay as they are unless you said otherwise
- Or adopt nothing, and keep the whole thing as a what-if
Before you ask
- Can a simulation tell me whether to hire another technician?
- That is its main job. Add the technician to a scenario, run it against the frozen baseline, and read production value per route, utilization and labour cost for both. You see what the month looks like with and without them before you write a job advert.
- Can I test splitting a territory?
- Yes. Redraw the service areas inside a scenario, or let the planner find balanced territories itself, then compare the result against today’s setup. You can also see what an area is worth only after the run, because until it is planned nobody knows whether one technician can actually carry it.
- Does running a simulation change anything live?
- No. A simulation works on a frozen copy of the office and touches neither your schedule nor FieldRoutes. Only adopting a scenario changes anything, and even then what reaches FieldRoutes waits for a confirmed write-back batch.
- Which plans include simulations?
- Grow and Scale. Grow models 6 months ahead, Scale 12. The Run plan covers the planner and the analytics without the simulation tooling.
See it run on your own month.
30-minute intro call. We connect to FieldRoutes read-only, rebuild a real month of your routes against the goal you name, and walk you through the result. Nothing is written back.
You will have seen your own numbers before anyone asks you for anything.
From the blog
Latest Growth Planning articles from the PestRouting blog
Hands-on guides, case studies, and operational deep dives in Growth Planning.

Why Growing Pest Control Companies Outgrow Manual Route Planning
Manual route planning works until it suddenly doesn't. The breaking point is more predictable than most owners think. Watch for these five forces.
Read articleHow to Plan New Service Areas Without Breaking Existing Routes
New pest control service areas usually break existing routes. Use this five-step capacity, density, and territory plan before you start selling there.
Read article
When Should a Pest Control Company Add Another Technician?
A full calendar is not a hiring signal. Productive hours, drive time, route density, overtime, and recurring load are. Here is the decision framework most owners need.
Read articleGet Your Free Route Audit
A 30-minute intro call, a written report on what your routes are leaving on the table, and zero pressure to sign anything. We only follow up if you ask.
Book Your Free Analysis
Free analysis with no obligation
We'll analyze your current routes and show you the savings potential.
First call within 24–48 hours
Full analysis and written report typically ready within about a week.
Dedicated Route Success Manager
A routing specialist works your operation — not a ticket queue.
Risk-Free Opportunity
See exactly how much you could save before spending a dime.