Next month’s routes, in the time it takes to drink a coffee.
A whole month of routes in one run — and every promise your office already made still kept.
Built on top of FieldRoutes, not instead of it. How we handle your data
Everything PestRouting does, in four parts.
In the order operators actually ask about them. Each one below carries a screen from the product itself.
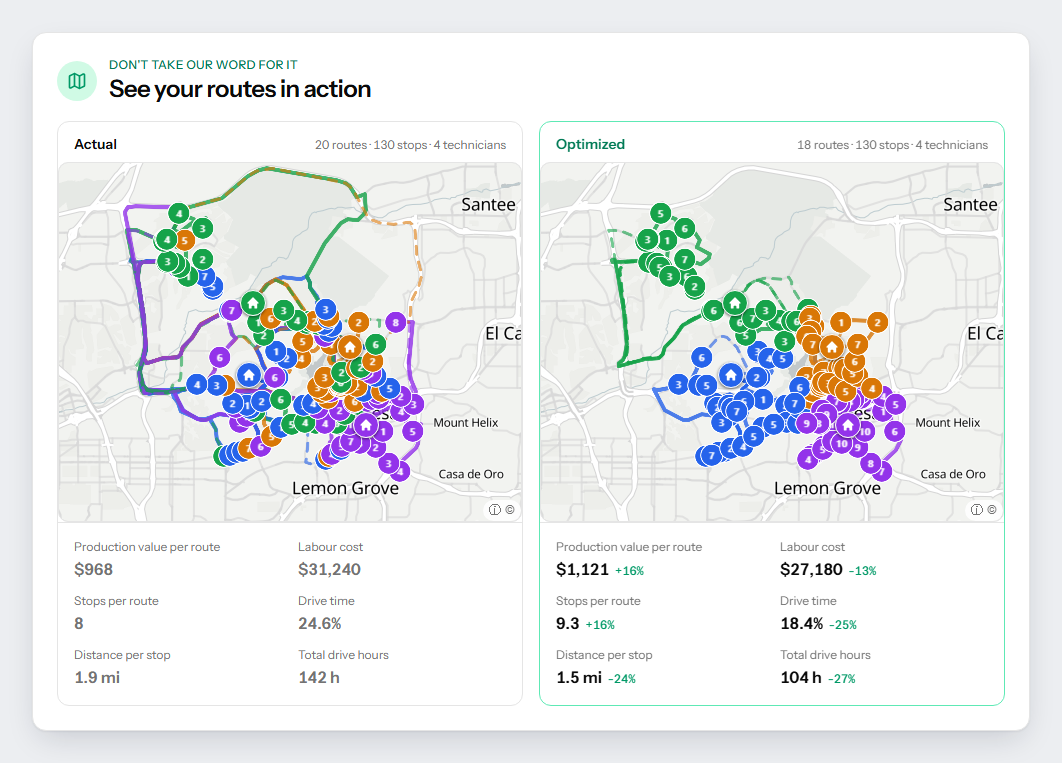
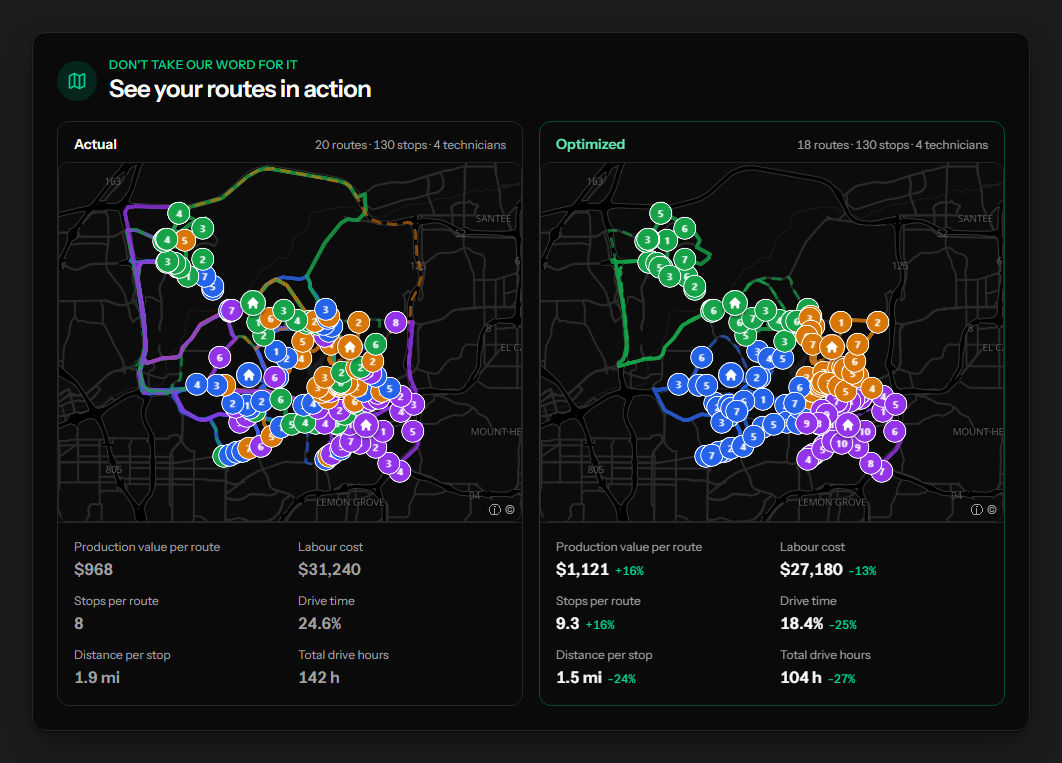
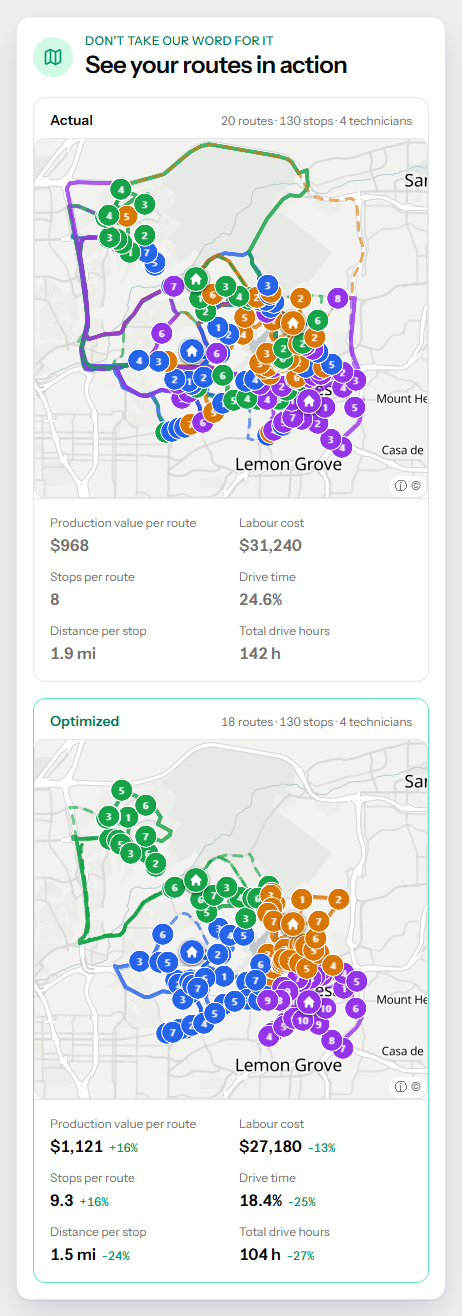
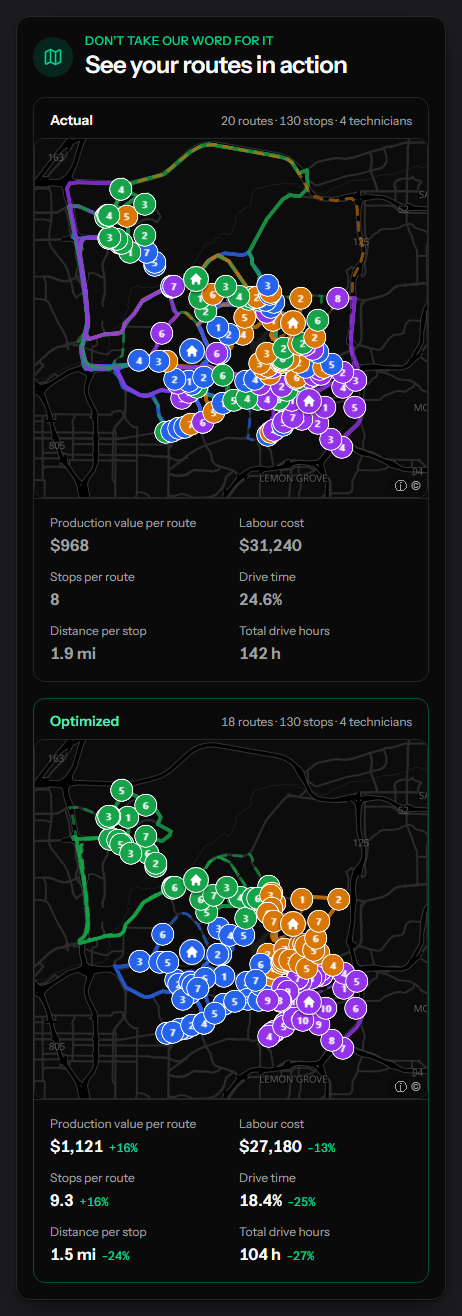
But is it actually better?
What the audit finds when it re-plans a month you have already run.
- 15–30%
- fewer miles
- per technician route
- 10–25%
- less drive time
- per technician per day
- 15–40%
- more production
- typically 2 to 4 more stops per route
Verified ranges from real pest control operations. What they are worth to you depends on the slack in your routes today — which is why the audit runs on a month you have already paid for, and sometimes comes back saying your routes are already tight. How we measure every number we publish
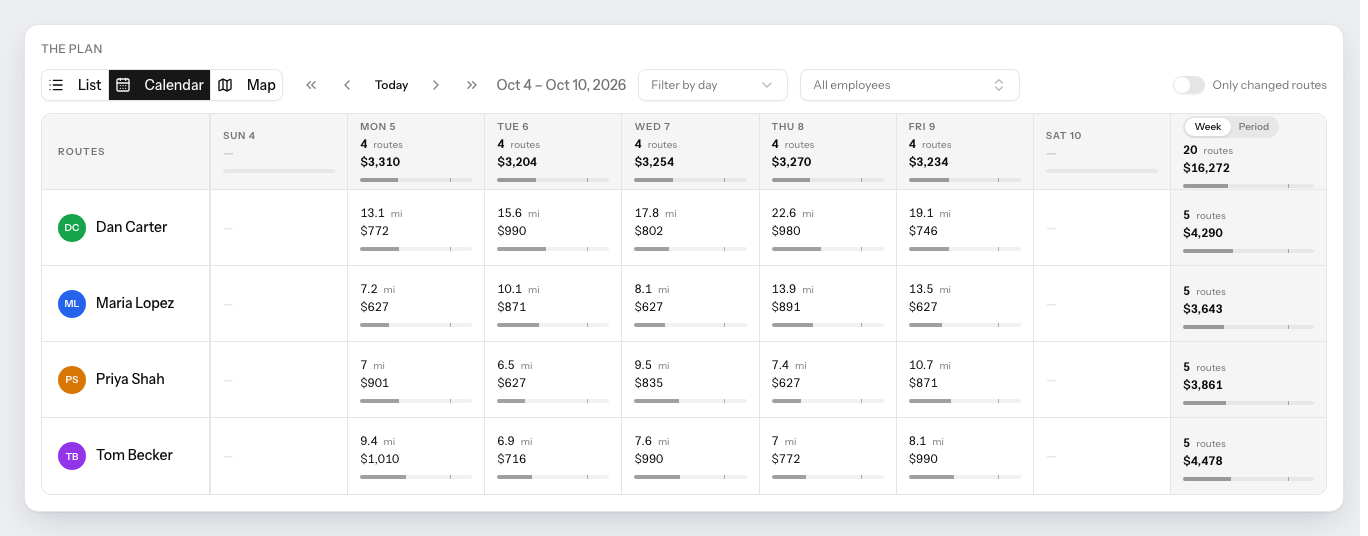
Planner
One run builds the month, inside the rules you set.
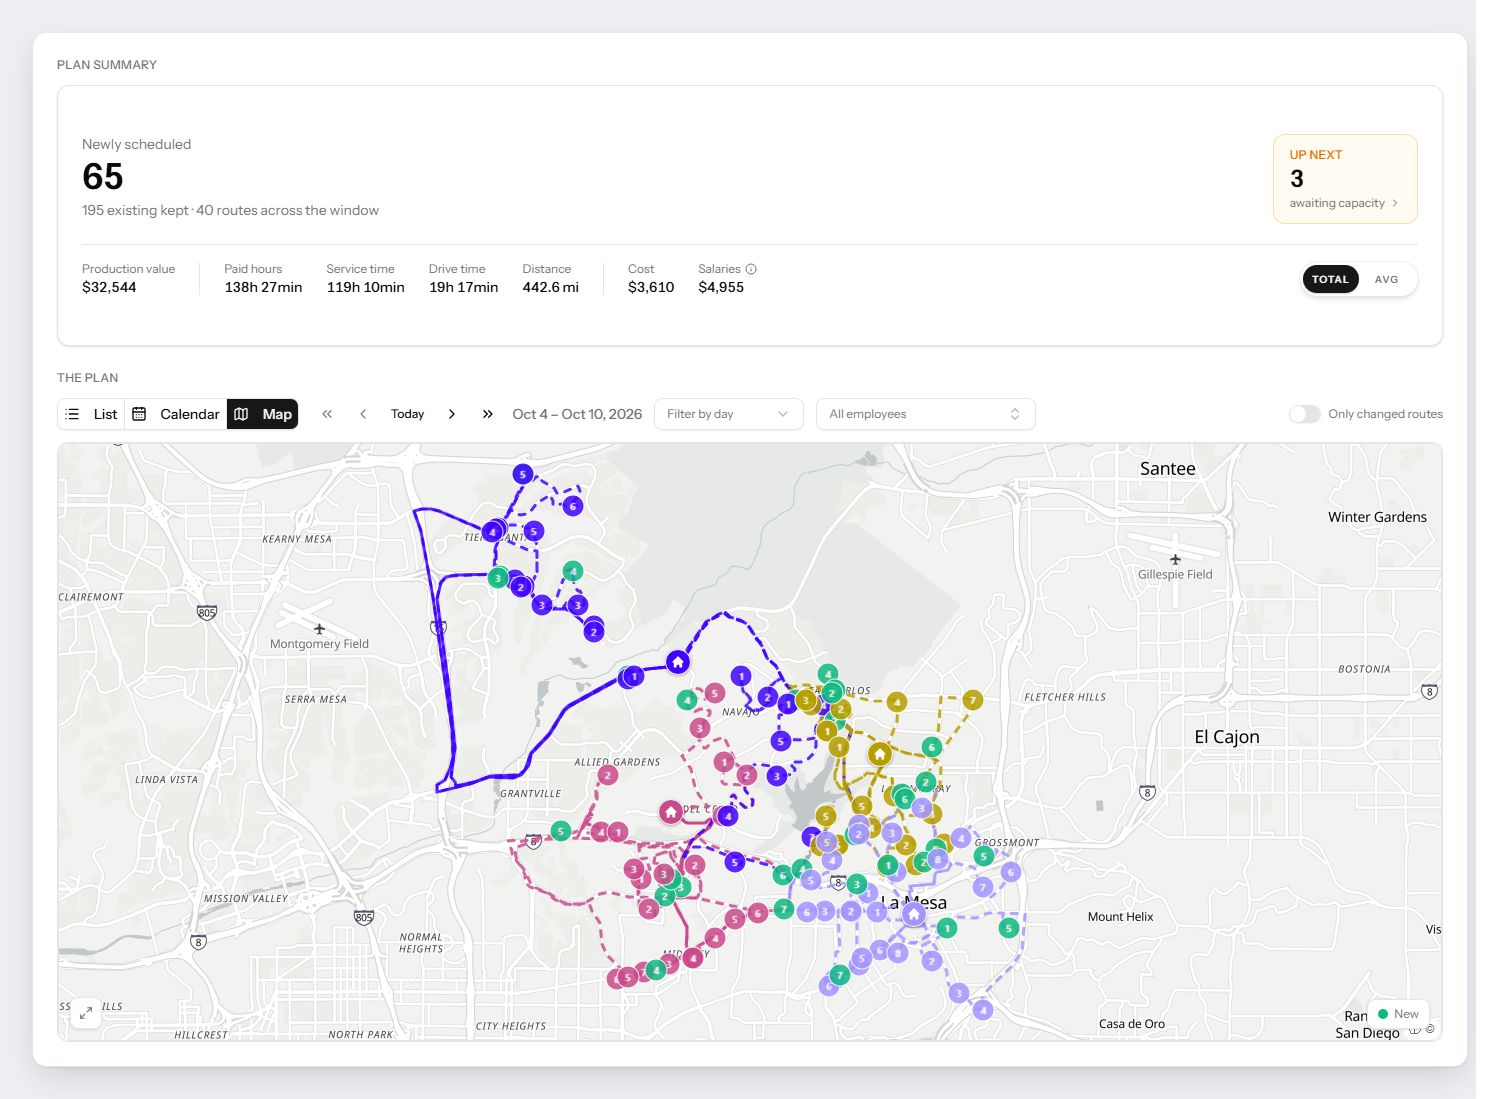
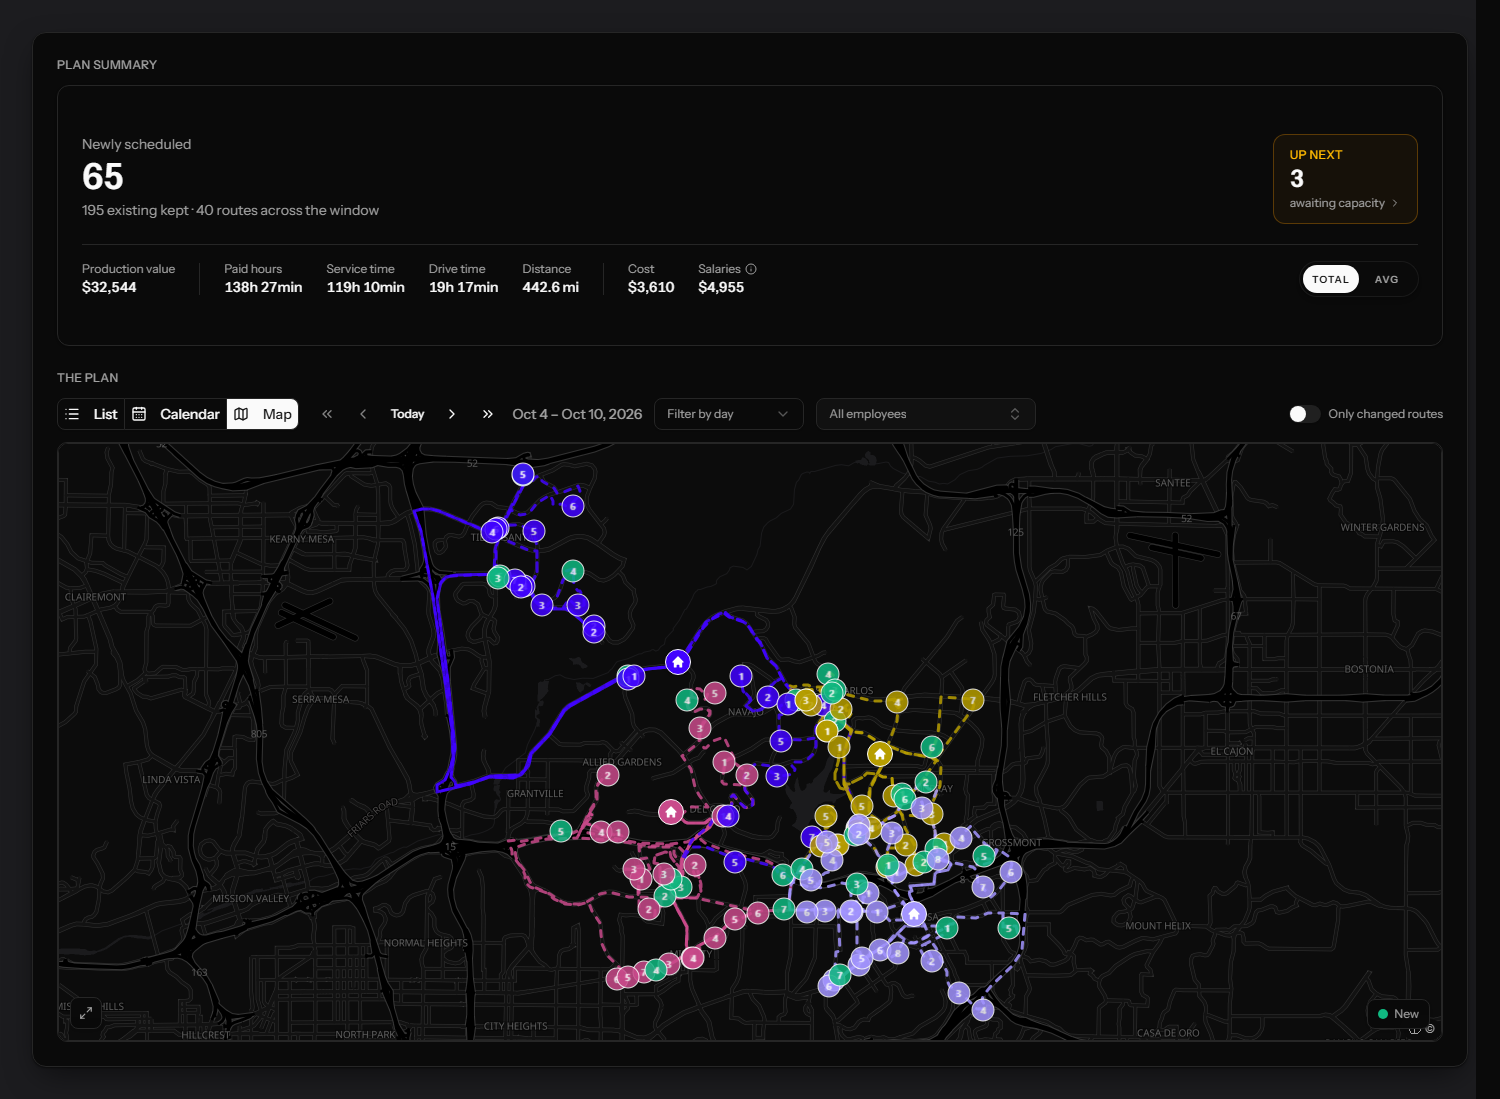
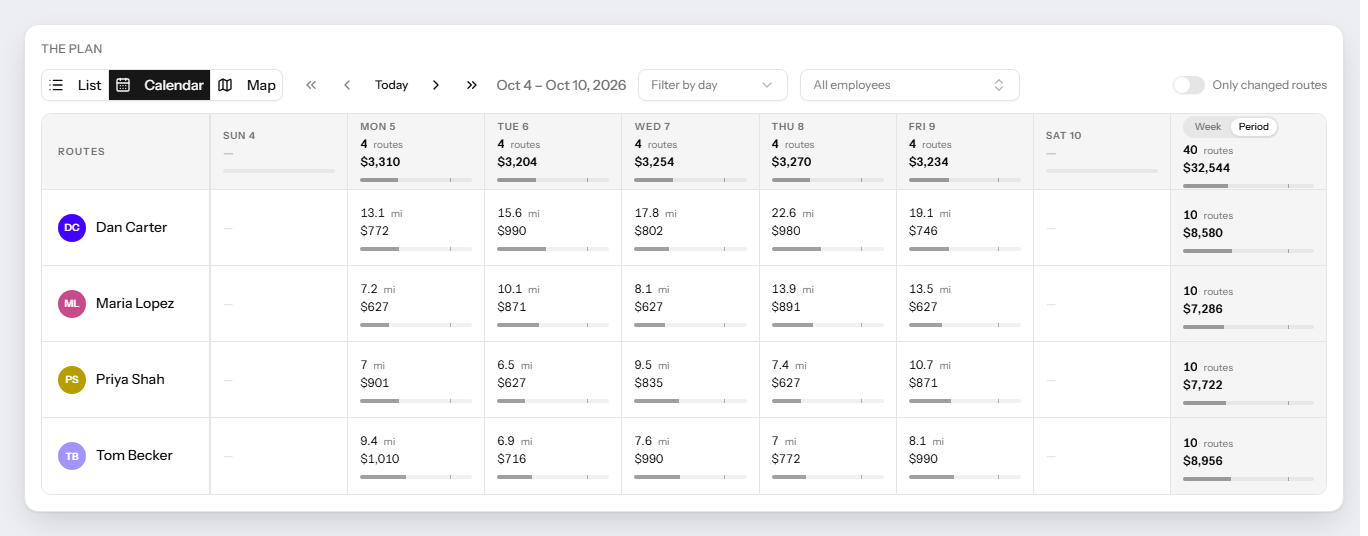
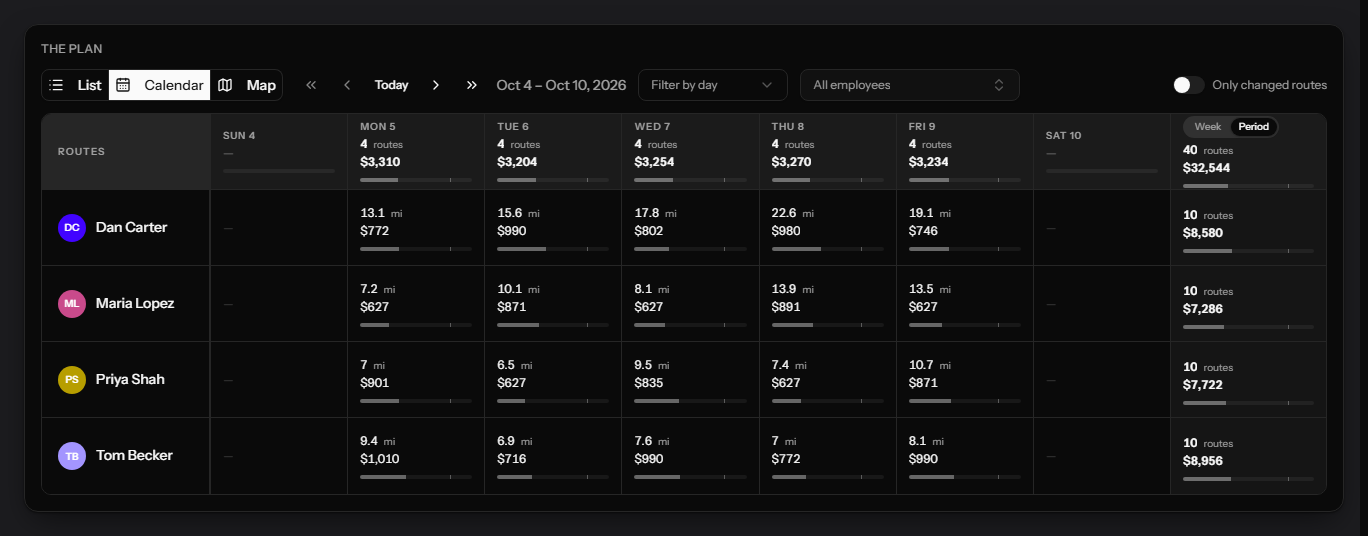
Pick an office and a range — a week, a month, a quarter — and every technician’s routes come back finished. What it is allowed to touch is yours: which days are frozen, who may take which work, and whether it optimizes for fewer routes or an even load.
What it covers
- Plan by hand, or on a schedule you set once
- Freeze the next days so promises survive
- Skills, preferred and banned technicians as hard rules
- Optimize for fewer routes — or for a fair share
Simulations
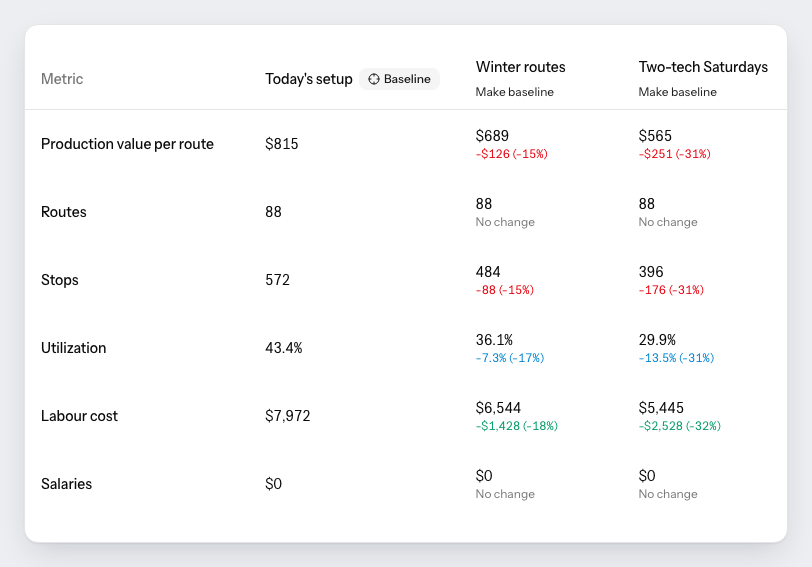
Price the decision before you make it.
Freeze one office and try the expensive questions against it. A fifth technician, a territory split, two people on Saturdays — side by side, on your own data.
What it covers
- Add or remove technicians, re-zone, change frequencies
- Several ideas against today’s setup at once
- Up to 12 months ahead, by plan
- Adopt the winner, or leave it as a what-if
Analytics
What each route earned, against the plan it came from.
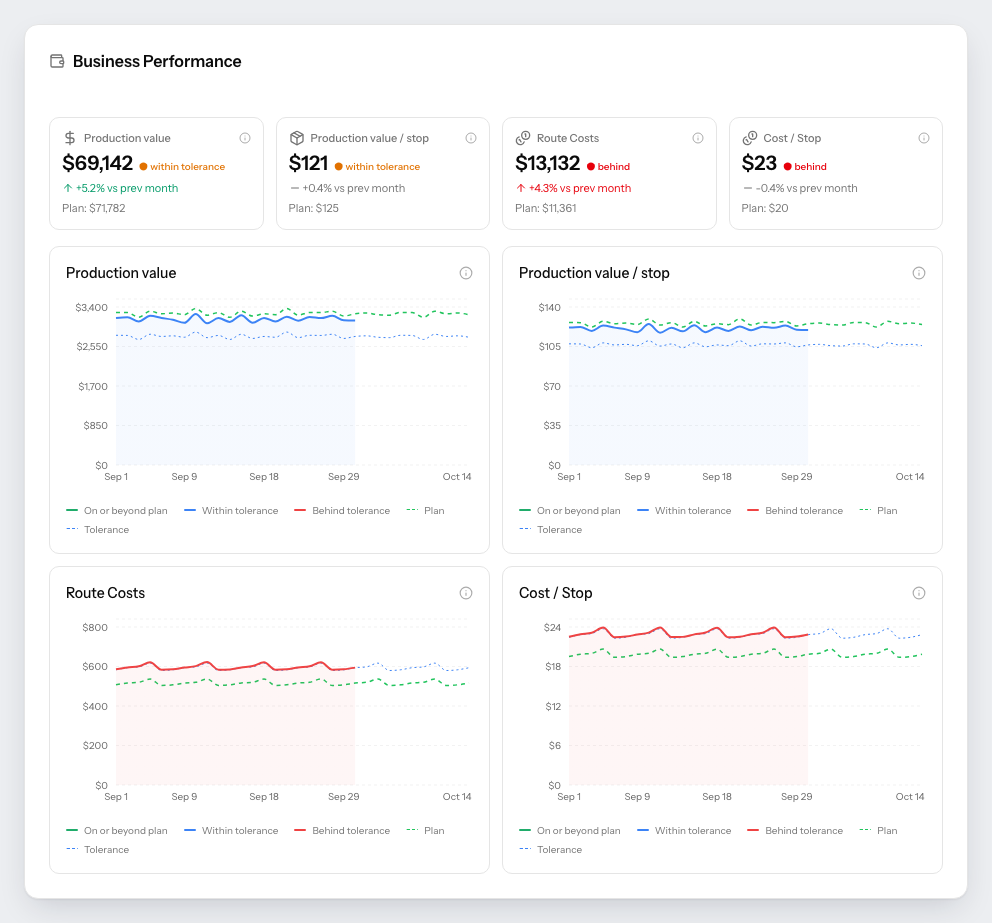
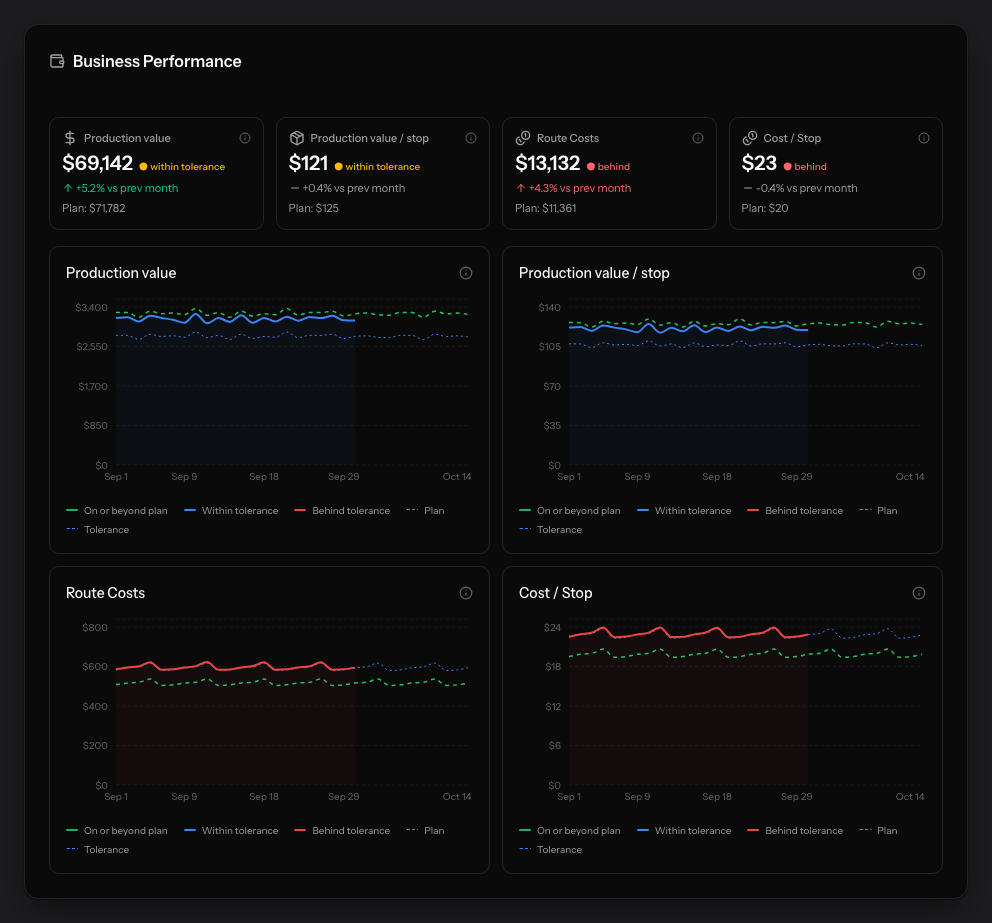
Most offices can see how many jobs a technician had, not what those jobs were worth. Twelve figures, every one of them beside its planned value, and three lamps per route against a target you set.
What it covers
- Production, cost and drive time against plan
- Published targets: 85%, 90%, 80%, ±10%
- Route health lamps on every day of the week
- Last week’s no-shows, with the next step
Configuration
Describe the operation once. Draw the rest.
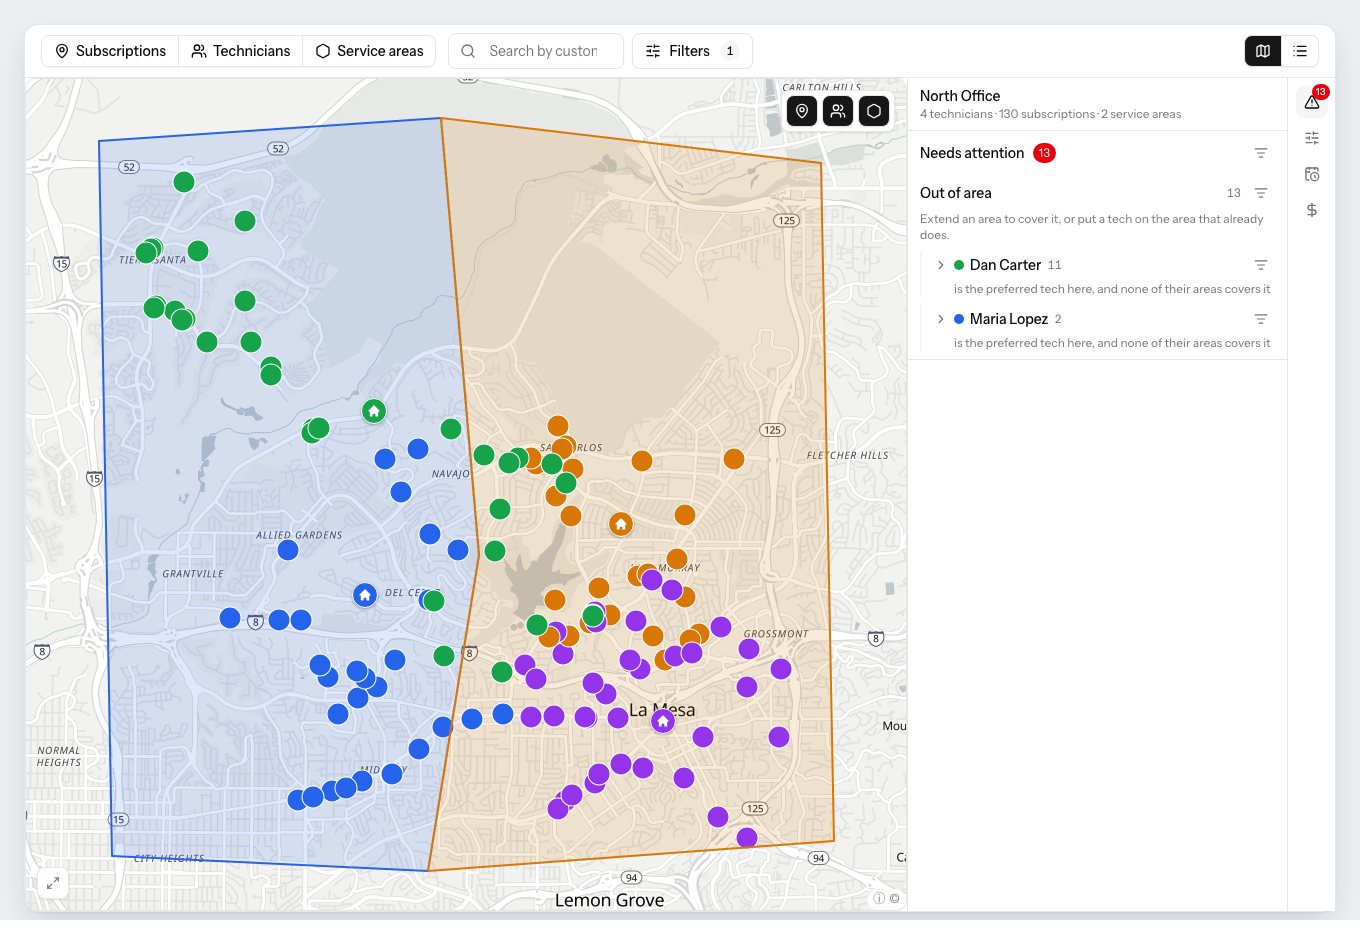
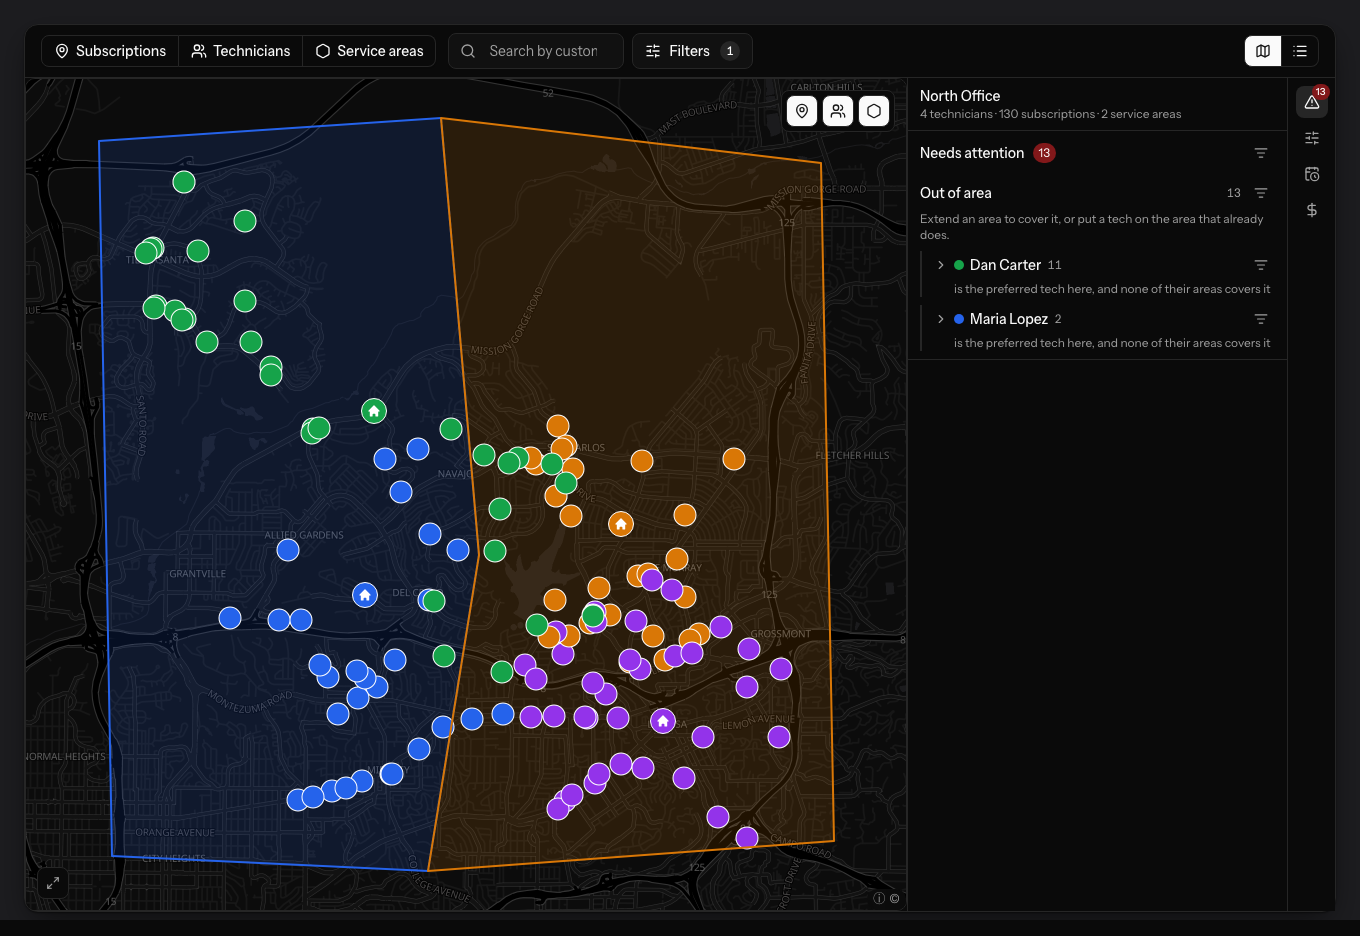
Territories you draw yourself or let the planner find, every technician’s calendar and cost, and a panel that names each customer no route can currently reach.
What it covers
- Draw service areas, or have them balanced for you
- Work calendars, holidays and part-time weeks
- Cost per hour, per mile, per route — per office
- Every blocker listed before it costs you a plan
- Reads
- Customers, subscriptions, appointments, technicians, skills — every night, per office.
- Writes
- Only a batch you confirmed. A locked appointment is never moved.
- Until then
- Read-only, until a confirmed test run against your own account turns writing on.
Curious what these numbers say about your operation?
We will run the analysis on one real month of your FieldRoutes data — free.
We listen first. Then you decide if a real audit makes sense.
The human layer
Software you run, with someone to call when it matters.
Most weeks the planner runs and the analytics tell you where to look. The exceptions are the expensive decisions — a territory redraw, the next hire, a branch opening — and those are worth talking through with someone who has seen the pattern before.
- The audit is a conversation, not a form
- A person pulls a real month of your data, reads it, and walks you through what they found — including when the finding is that your routes are already tight.
- Someone is reachable from every page
- Questions about a plan the software produced, or a decision it surfaced, go to a human who has seen the same pattern in other operations.
- Nothing in the product waits on us
- Planning, simulations, adoption and analytics are all yours to run. We are the exception you call, never the step you have to book.
Three plans, published in full, month to month. See what PestRouting costs
Before you ask
What operators want cleared up first
- Is PestRouting software or a service?
- Software. Your office logs in and runs the planner, the simulations and the analytics itself. A person runs the free audit with you and is reachable afterwards, but you are not dependent on us to operate the platform day to day.
- Do my technicians have to learn a new app?
- No. PestRouting plans the routes, and once you confirm the write-back the schedule lands in FieldRoutes. Your technicians keep opening the same app they already use; the day inside it is simply a better one.
- Can PestRouting change something in FieldRoutes without me?
- No, and it takes three separate human decisions to get there. A plan only becomes your schedule when somebody adopts it. Adopting still sends nothing — it creates a write-back batch. The batch only goes out when somebody confirms it, and an unconfirmed batch expires after 14 days. Before any of that, the connection is read-only until a seven-step activation has run a confirmed test against your own account.
- What stops it from moving a visit we promised to someone?
- Planner rules. Every day inside the horizon sits in one of four modes — anything may move, stays on its day, stays as booked, or nothing moves — and you set them as exceptions by how far out a day is, so the next two or three days stay frozen without anyone having to remember. A visit your office locked is never moved under any mode: the whole technician day is refused rather than written partly.
- How far ahead can I plan?
- Planning horizons are 30, 60 or 90 days depending on your plan, worked day- and week-wise inside that window. Looking further out is a different tool: simulations model 6 or 12 months ahead on the Grow and Scale plans, and answer questions like hiring or opening a territory rather than producing the schedule your technicians run.
- What does the platform actually measure?
- Every completed route is compared against the plan it came from, across three tabs. Business Performance: production value, production value per stop, route costs and cost per stop. Field Operations: distance per stop, drive time share, stops per paid hour and production per paid hour. Planning Quality: stop adherence against an 85% target, route adherence against 90%, on-time rate against 80%, and work-time overrun held inside a ±10% band. How we measure every number we publish
- Who in my office is allowed to change the schedule?
- Whoever you give the rights to. Seats run from 3 to unlimited depending on plan and each one carries a role: a viewer can open a planning session and read the plan but change nothing, a planner can start sessions and adopt plans for their office, and confirming a write-back batch needs the planner role or higher. Someone can work a plan all day without being able to make it the schedule.
- Can I run more than one office?
- Yes. Between 1 and 10 locations depending on plan, each with its own FieldRoutes connection and sync, its own work calendar and holidays, its own cost rates and its own service areas. Settings flow down from the organization and an office overrides only what it needs to, so data does not bleed between branches.
See it run on your own month.
30-minute intro call. We connect to FieldRoutes read-only, rebuild a real month of your routes against the goal you name, and walk you through the result. Nothing is written back.
You will have seen your own numbers before anyone asks you for anything.
PestRouting Blog
FieldRoutes tips, route optimization guides, scheduling playbooks, and case studies built for pest control teams that want denser routes and stronger margins.

How to Decide Which Pest Control Accounts Are Too Expensive to Serve
Not every customer is a good customer. The math for spotting margin-destroying accounts is simpler than most owners think — once you actually do it.
How to Prepare Your Pest Control Routes Before Peak Season
Peak season exposes every operational shortcut you took during the slow months. These six pre-peak moves keep the wheels on.

Route Optimization ROI: Calculating the Real Value for Your Pest Control Business
Route optimization ROI should be measured as realized value, not vendor math. The real model includes adoption cost, baseline discipline, and savings that actually reach the P&L.
Get Your Free Route Audit
A 30-minute intro call, a written report on what your routes are leaving on the table, and zero pressure to sign anything. We only follow up if you ask.
Book Your Free Analysis
Free analysis with no obligation
We'll analyze your current routes and show you the savings potential.
First call within 24–48 hours
Full analysis and written report typically ready within about a week.
Dedicated Route Success Manager
A routing specialist works your operation — not a ticket queue.
Risk-Free Opportunity
See exactly how much you could save before spending a dime.