Analytics & route health
What each route earned, against the plan it came from.
Most offices can see how many jobs a technician had and not what those jobs were worth. Here it is a column — production per route, per paid hour, per stop — next to the plan that produced it.
The daily cockpit
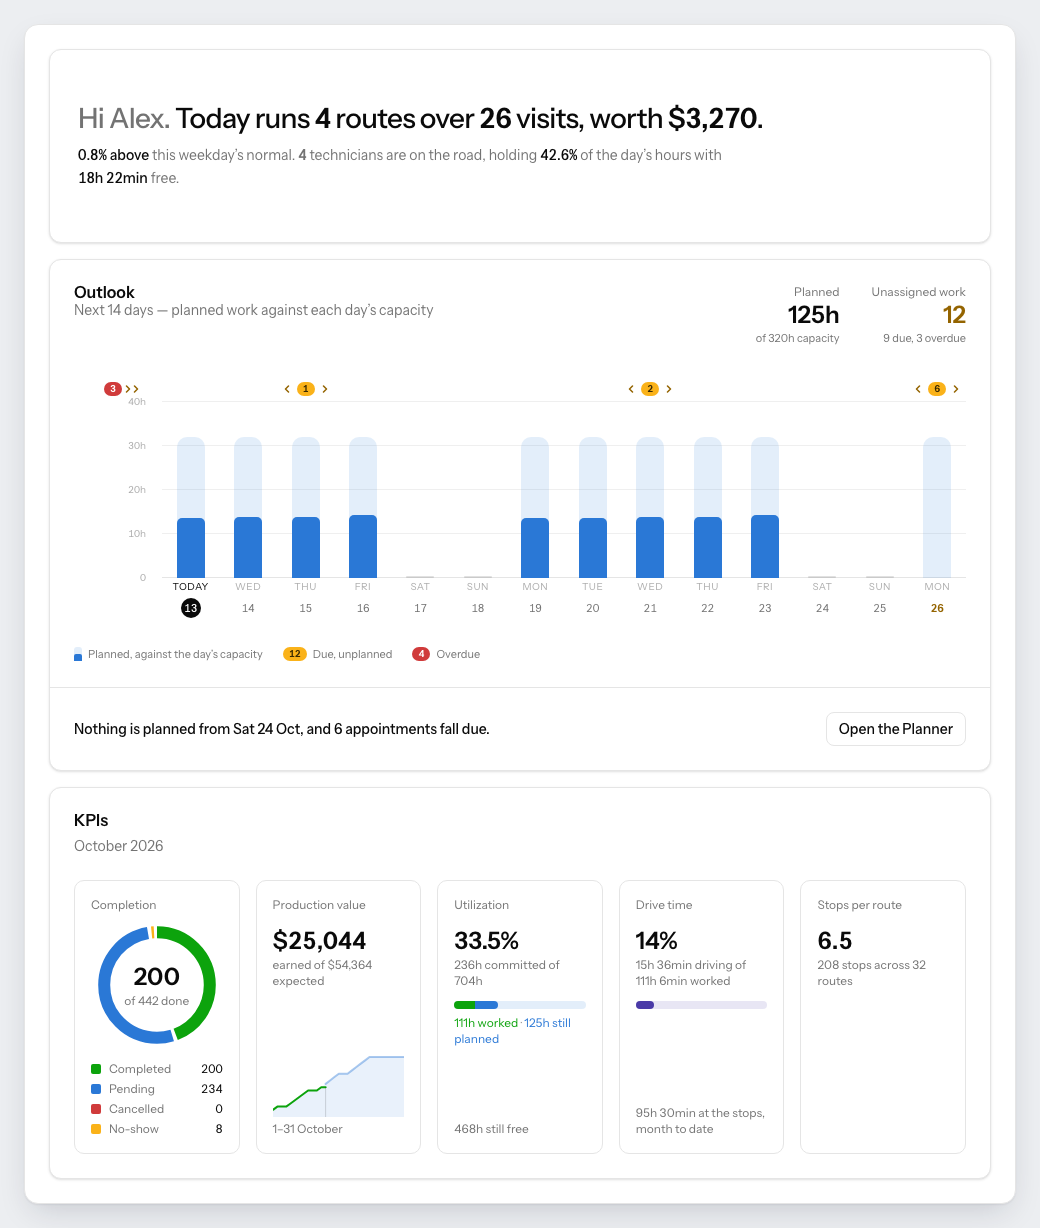
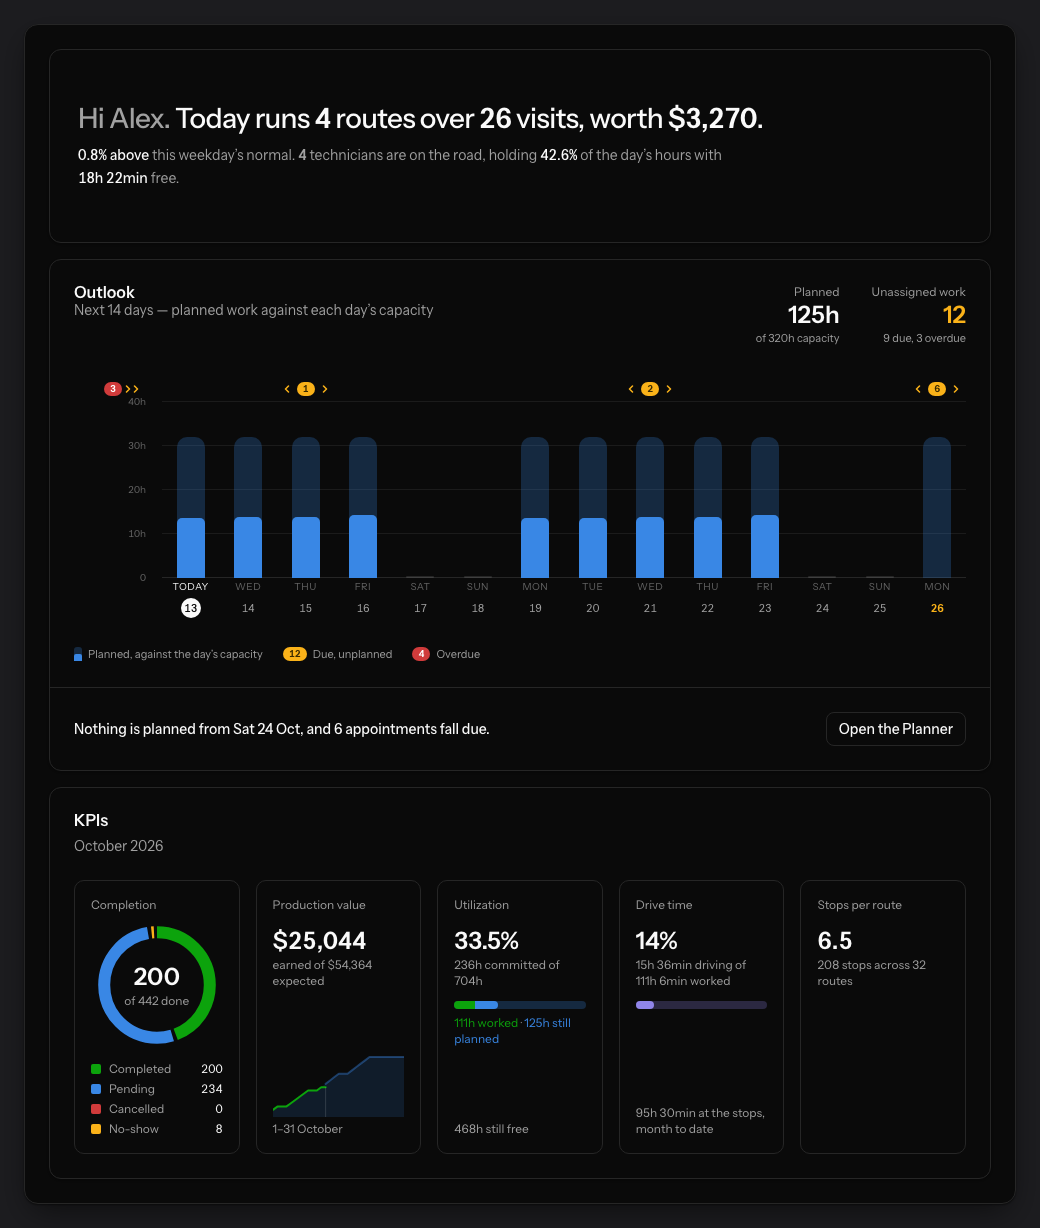
Three bands answer the morning’s three questions.
What today holds, whether the next fortnight has room for the work that is due, and how the month is going. The outlook draws planned hours against each day’s real capacity, so a day booked past its overtime ceiling is visible before anybody drives it.
- Today’s routes, visits and value in one sentence
- 14 days of planned work against capacity, with overtime marked
- Work that is due or overdue and on no route yet
- Completion, production, utilization, drive time, stops per route
Field operations
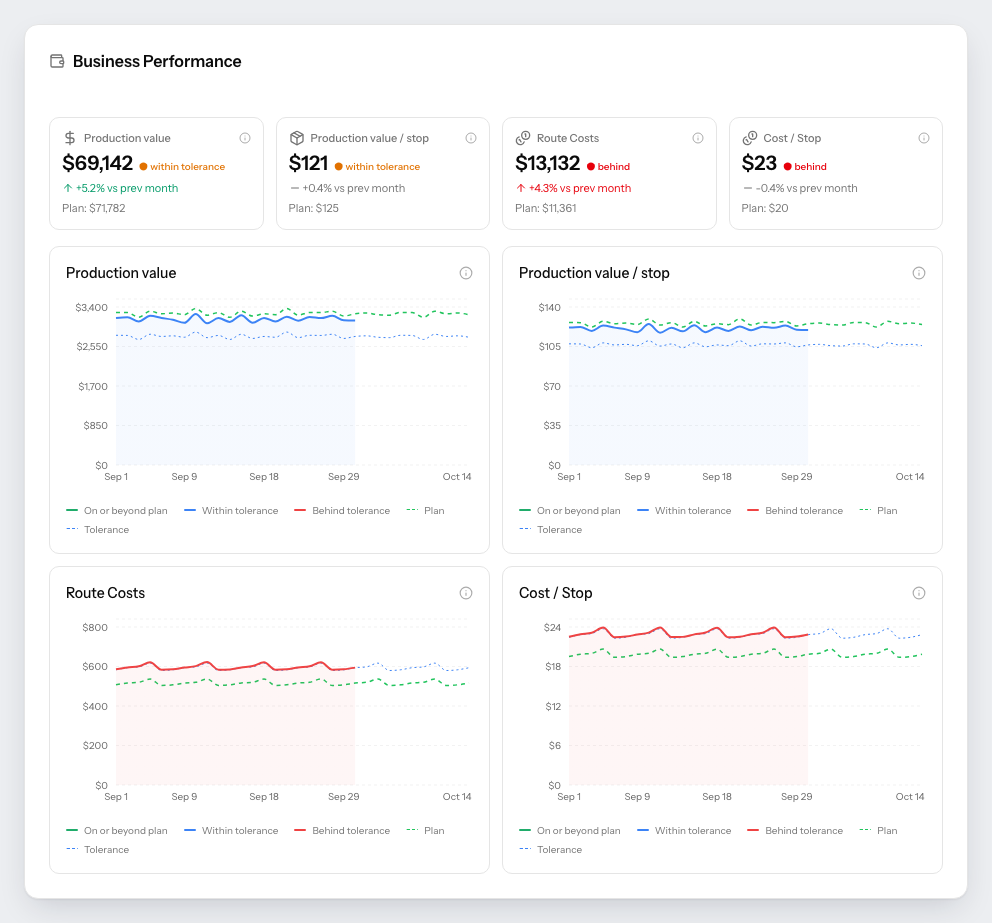
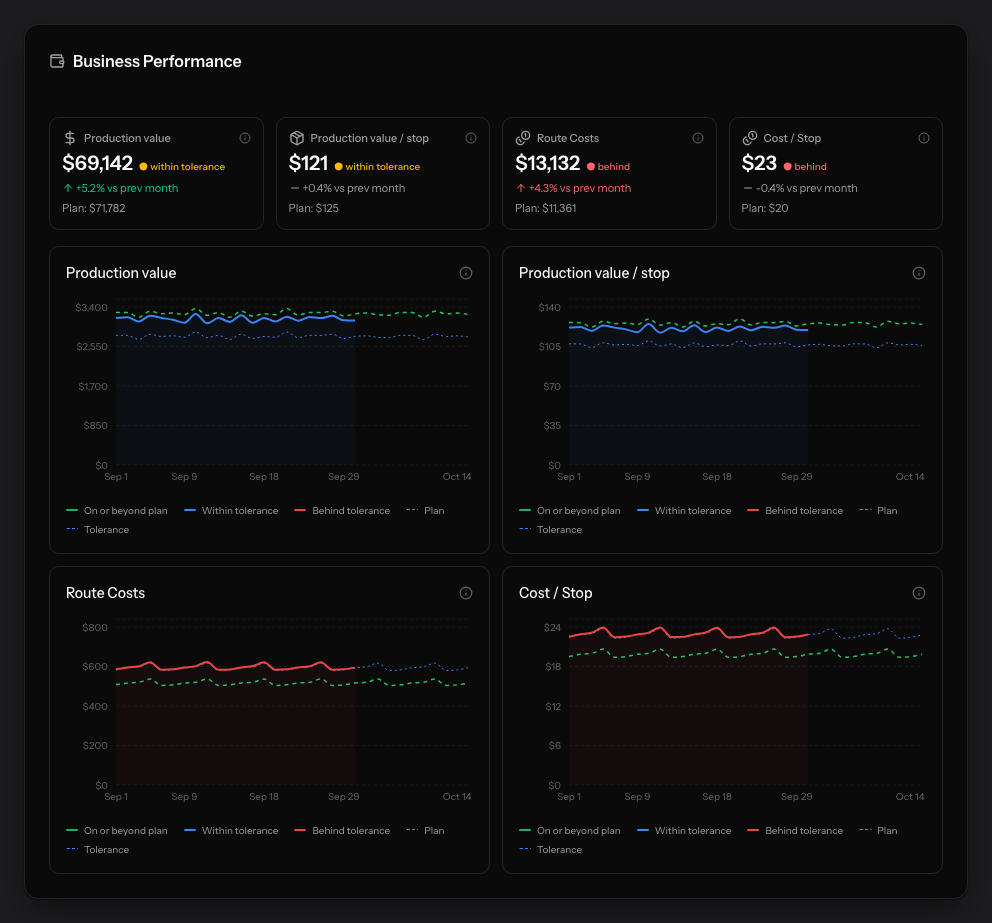
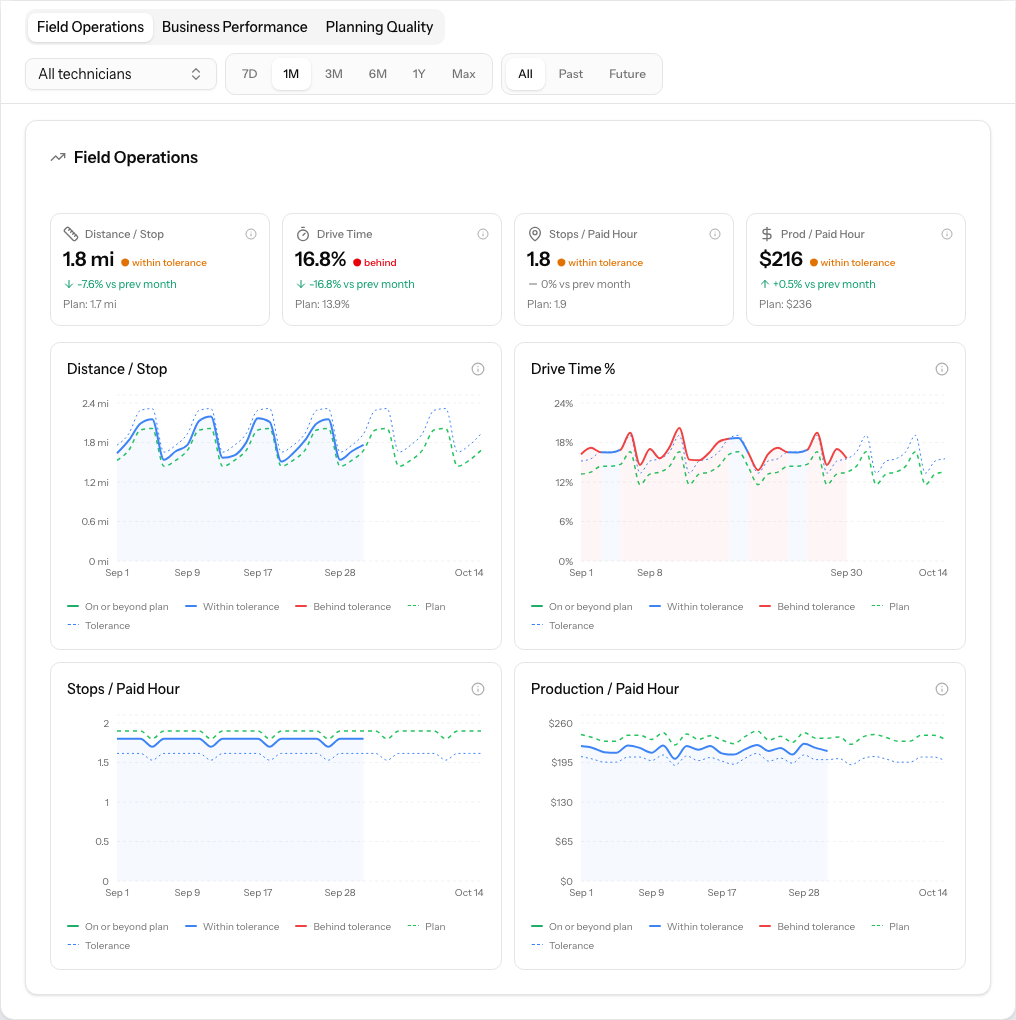
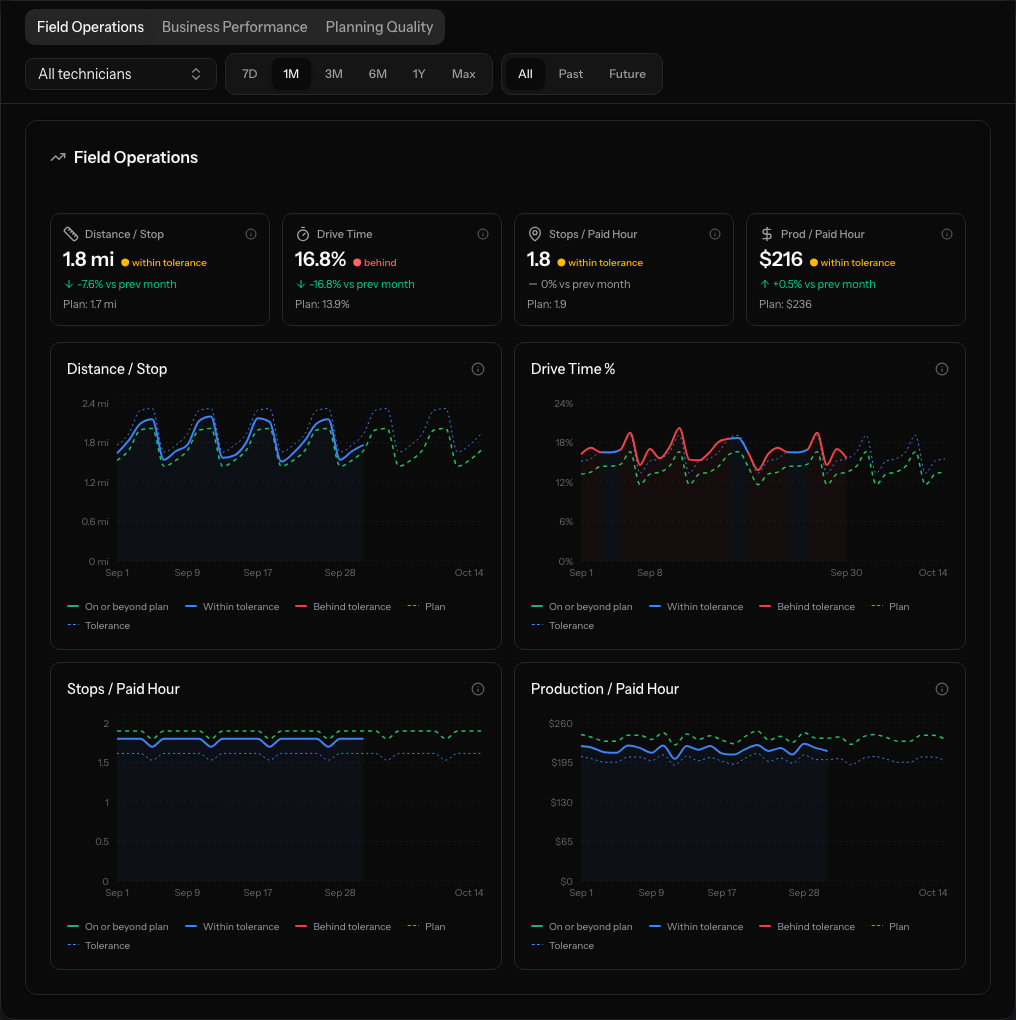
Twelve figures, three tabs, every one beside its plan.
Business Performance holds the money, Field Operations holds how the routes ran, Planning Quality holds whether the plan held. Each tile is rated on target, within tolerance or behind — against the plan for the same days, not a benchmark from somebody else’s business.
- Production value, value per stop, route costs, cost per stop
- Distance per stop, drive time share, stops and production per paid hour
- Any single technician, from the last 7 days to all time
- A chart per figure: solid is actual, dashed is plan
Planning quality
Four targets we publish and can be held to.
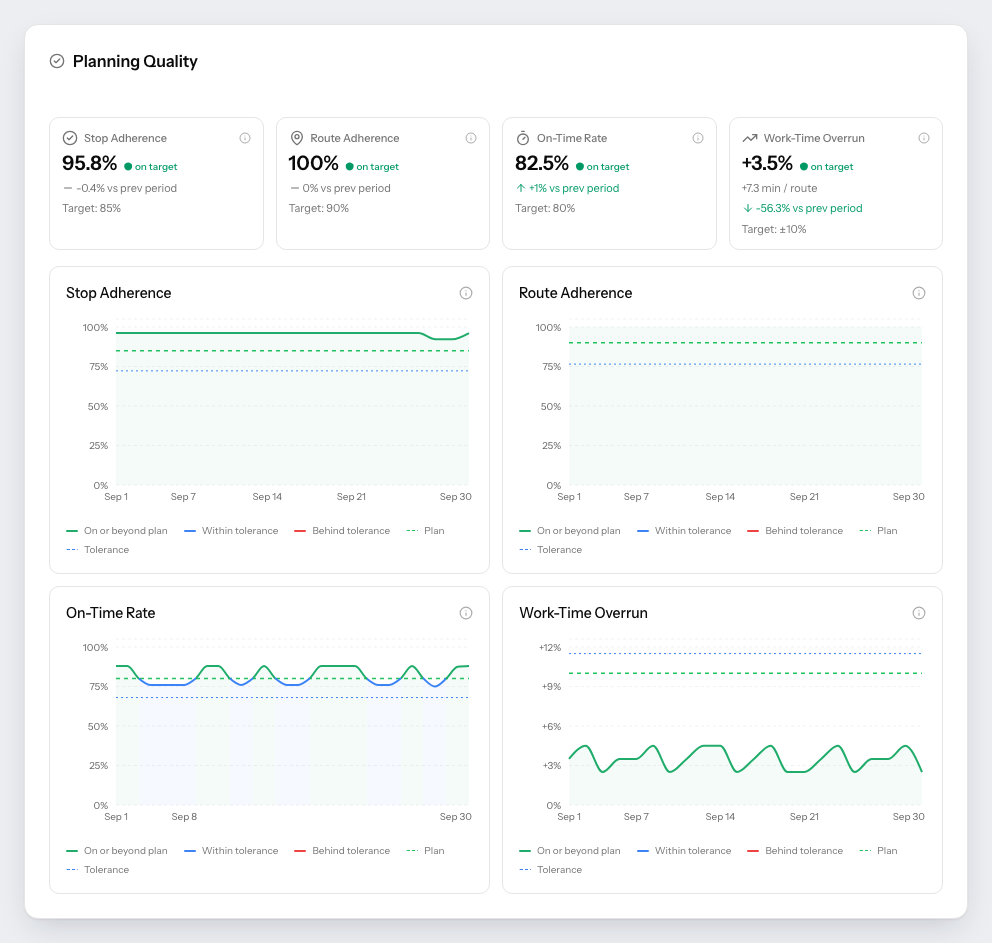
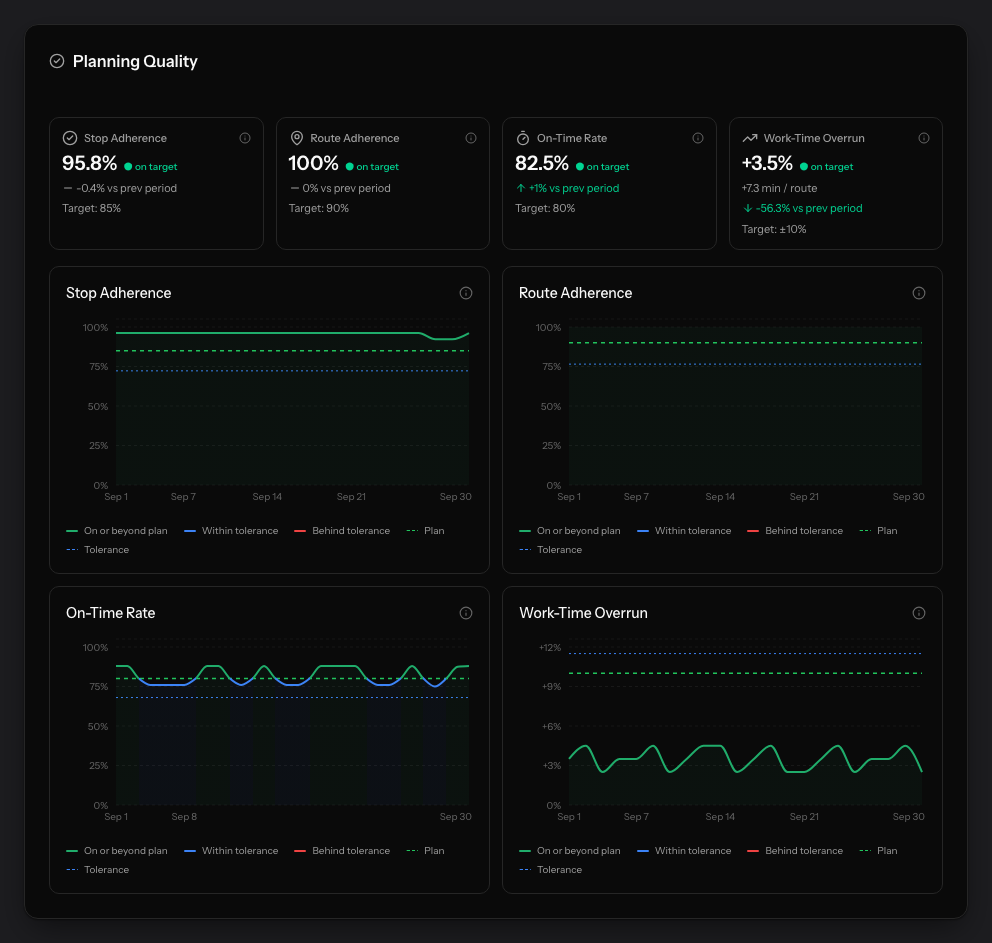
A plan that looks excellent and runs at 70% stop adherence is not an excellent plan. These four say whether the route book survived contact with the day, and each one carries a target rather than a vague direction.
- Stop adherence — planned stops done on the planned day — target 85%
- Route adherence — planned technician days that ran — target 90%
- On-time rate — arrival within ten minutes of plan — target 80%
- Work-time overrun — drive plus service against plan — within ±10%
Route health
Three lamps per route, against a target you set.
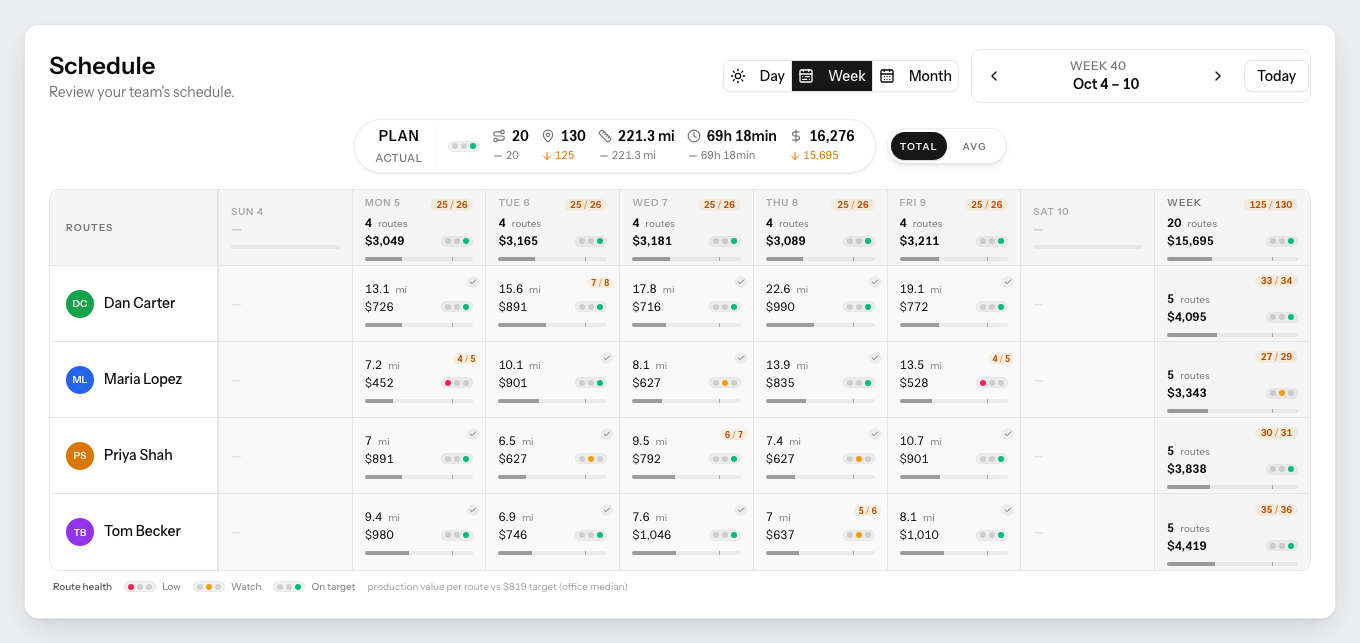
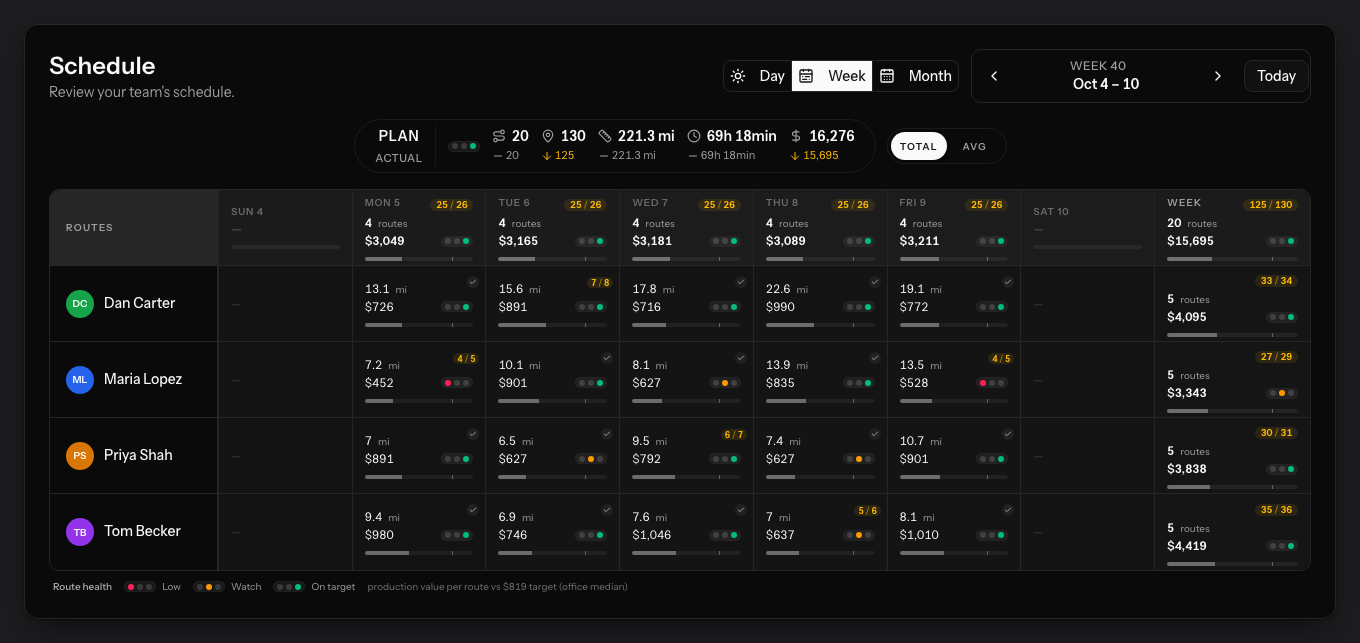
Grade every route against the production value you expect from one — a fixed amount you type, or your own office median, kept current automatically. The week view then shows at a glance which routes carried their weight and which did not.
- A fixed target per route, or the office’s own median
- On target, Watch and Low, with the shares you choose
- Planned days graded too, so a thin route shows before it runs
- Plan next to actual on every day that already ran
Follow-up visits
Last week’s misses, with the next step attached.
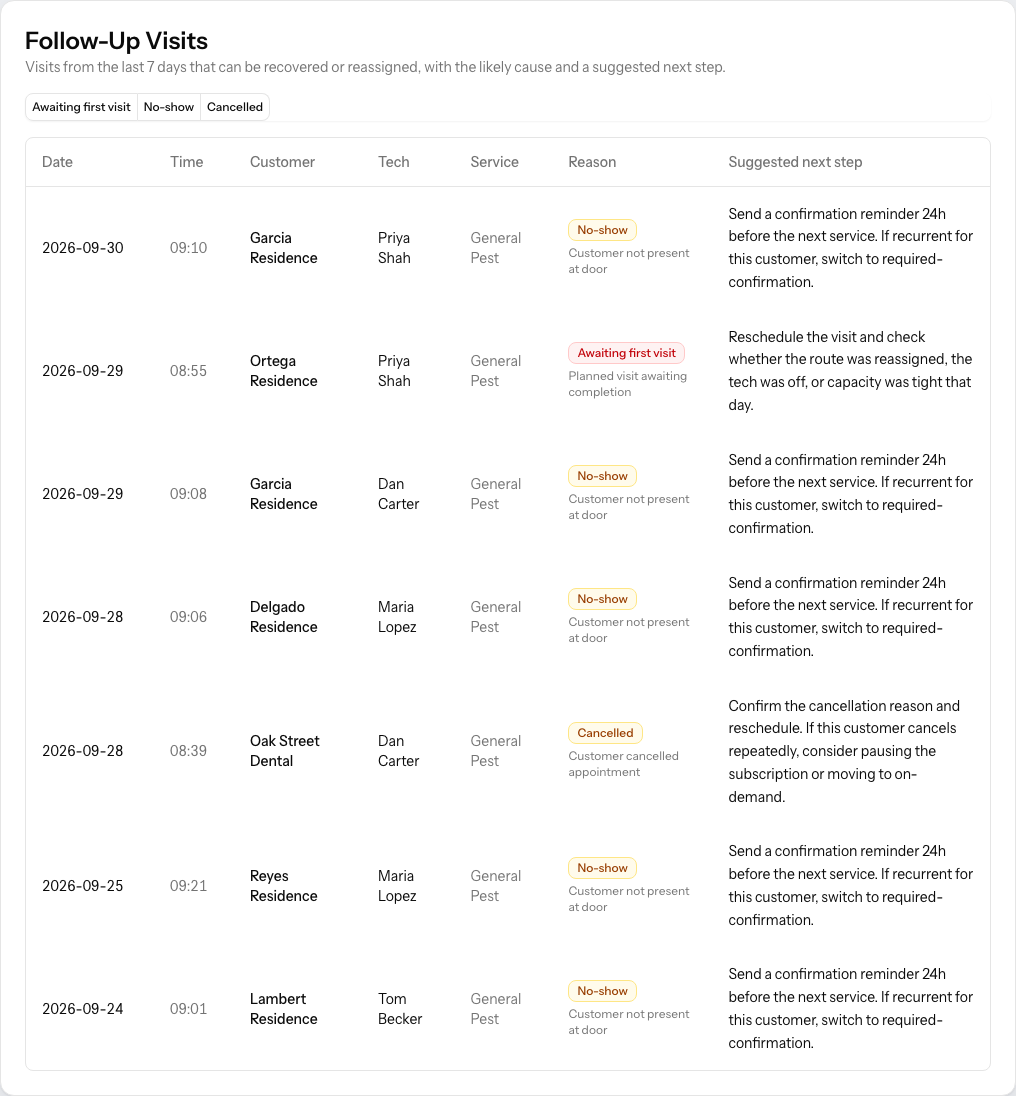
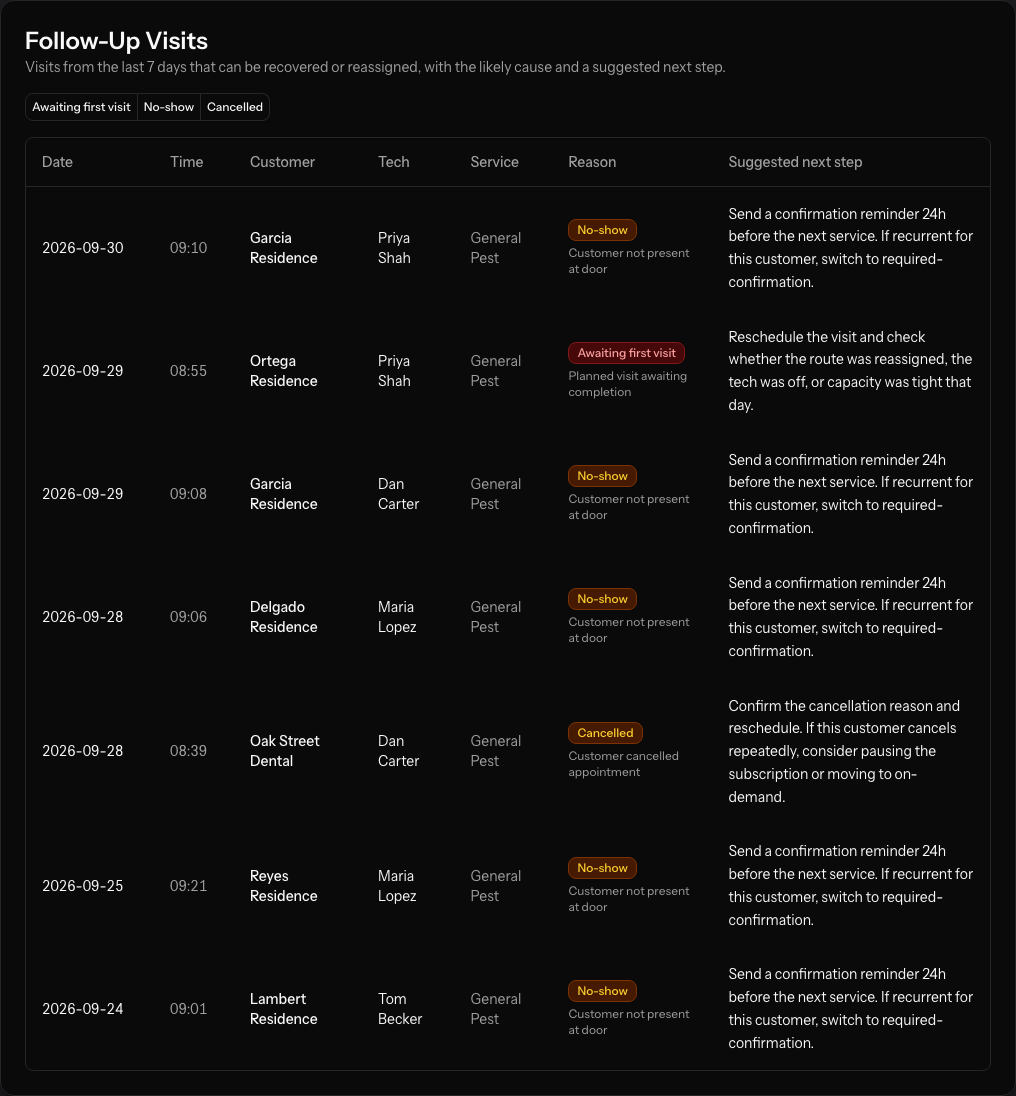
Every visit of the last seven days that was not completed, grouped by what happened: nobody was home, the customer cancelled, or the first visit never took place. Each row names the likely reason and what to do about it, so they get rebooked instead of quietly lost.
- Awaiting first visit, no-show and cancelled, filtered apart
- The customer, the technician, the service and the reason
- A suggested next step on every row
- Low stop adherence has a list of addresses behind it
Before you ask
- Can I see what each technician actually produced?
- Yes, and that is usually the number offices cannot get today. Filter any tab to one technician and you get their production value, production per paid hour, stops per paid hour, distance per stop and drive time share — each beside the plan for the same days.
- What are the figures compared against?
- The plan you adopted for those same days, not an industry benchmark. Days before your first adopted plan count as actual only, so the comparison starts honestly on the first planned day and the card says how many days it covers.
- Where do the numbers come from?
- Actuals come from your field service software once technicians close their visits, and the plan comes from the planning session you adopted. Costs use your own cost configuration — per route, per paid hour, per overtime hour and per mile — so route cost is your rate, not an estimate.
- Can I set my own target for a good route?
- Yes. Route health grades every route against a production value per route that you choose: a fixed amount, or your office’s own median kept current automatically. You also set the shares that count as On target and Low.
See it run on your own month.
30-minute intro call. We connect to FieldRoutes read-only, rebuild a real month of your routes against the goal you name, and walk you through the result. Nothing is written back.
You will have seen your own numbers before anyone asks you for anything.
From the blog
Latest Profitability Boost articles from the PestRouting blog
Hands-on guides, case studies, and operational deep dives in Profitability Boost.

How to Decide Which Pest Control Accounts Are Too Expensive to Serve
Not every customer is a good customer. The math for spotting margin-destroying accounts is simpler than most owners think — once you actually do it.
Read articleHow Better Routing Improves Customer Experience
Customer experience in pest control is built into the route, not the marketing. Better routing is a retention strategy disguised as ops work.
Read article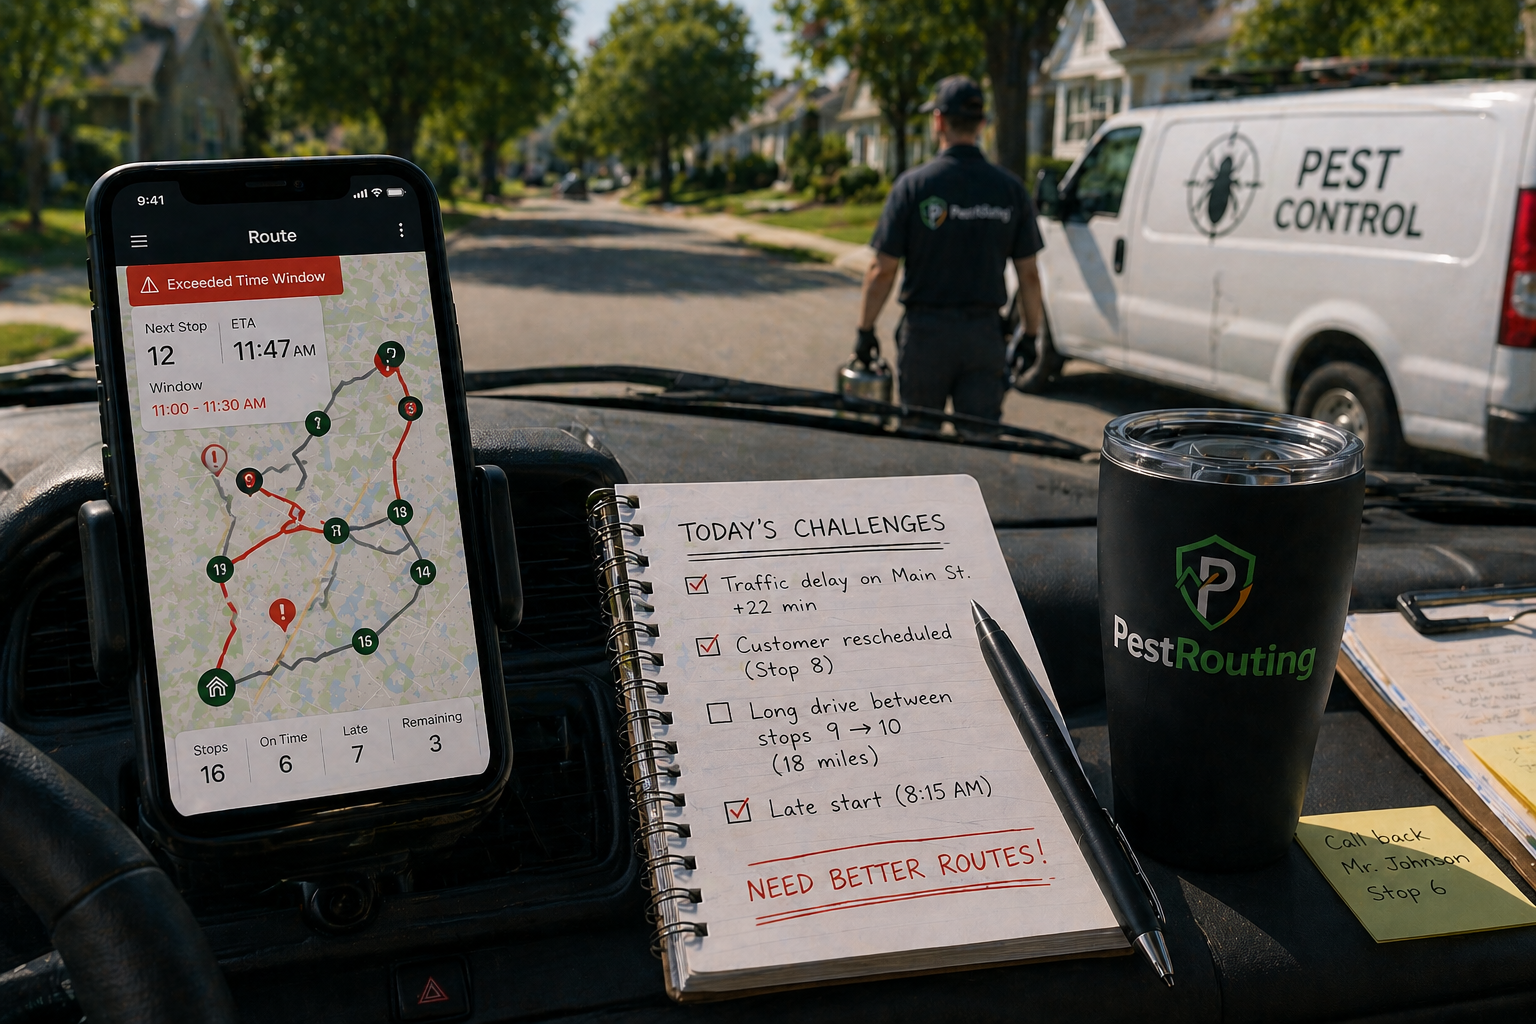
The Difference Between Busy Routes and Profitable Routes
A full route is not a profitable route. Revenue per service hour, drive time share, and callback rate decide whether your busiest techs actually make money for the business.
Read articleGet Your Free Route Audit
A 30-minute intro call, a written report on what your routes are leaving on the table, and zero pressure to sign anything. We only follow up if you ask.
Book Your Free Analysis
Free analysis with no obligation
We'll analyze your current routes and show you the savings potential.
First call within 24–48 hours
Full analysis and written report typically ready within about a week.
Dedicated Route Success Manager
A routing specialist works your operation — not a ticket queue.
Risk-Free Opportunity
See exactly how much you could save before spending a dime.