Technicians on commission · across state lines
33% more production per route. Every preferred technician kept.
Technicians earn a share of what they produce, so a fuller route is a better-paid route. The owner wanted more on every route without taking a single customer away from the technician they know.
The goal from the first call
Fuller routes, with every customer kept by their technician.
What the customer asked for
- More production per route, so more pay per route
- Customers kept with the technician of their zip code
- A technician who works only one state kept there
- The cost of a day counted from the first stop to the last
From the audit, and what goes in before the next run
- +33% Audit
- Production per route
- A past month planned again, every preferred technician kept.
- +38% Audit
- Without preferred technicians
- The same month without them. The office kept them anyway.
- 2 rules Audit
- Added before the next run
- A one-state technician, and the skills FieldRoutes never held.
The rules that had to hold
What the plan was not allowed to break
Preferred technician by zip code
Each zip code has its technician, and the plan keeps it.
One-state technicians
A technician who works only one state stays there. It goes in as a service area before the next run.
Pay from first stop to last
A day costs what it pays, counted from the first stop to the last.
Trucks go home
Every route starts and ends at the technician’s home.
Skills
Never entered in FieldRoutes, so the first run let anyone take any job. They go in next.
Visit lengths
Logged check-ins were too short to trust, so the audit used the standard lengths.
Step by step
From the first audit to a planned month
- 1
AuditAug 2026
One past month, planned twice
Once without preferred technicians and once with every one of them kept. Without them the month came to 38% more production per route. With them, 33%.
PestRouting · Compare scenariosCompare scenarios
One past month, planned twice
Metric As it ranBaseline Preferred technicians ignored Preferred technicians keptPicked Production per route Baseline +38% +33% Customers with their technician All Fewermoved for a shorter route All Five points less on paper, every customer still with the technician they know.
The audit’s own figures for this story, drawn for this page. Relative only. - 2
GoalAug 2026
Five points less, every customer kept
Production per route is what a technician on commission feels in their pay. The customer knowing who rings the bell mattered more to this owner than the last five points.
PestRouting · Who may take a stop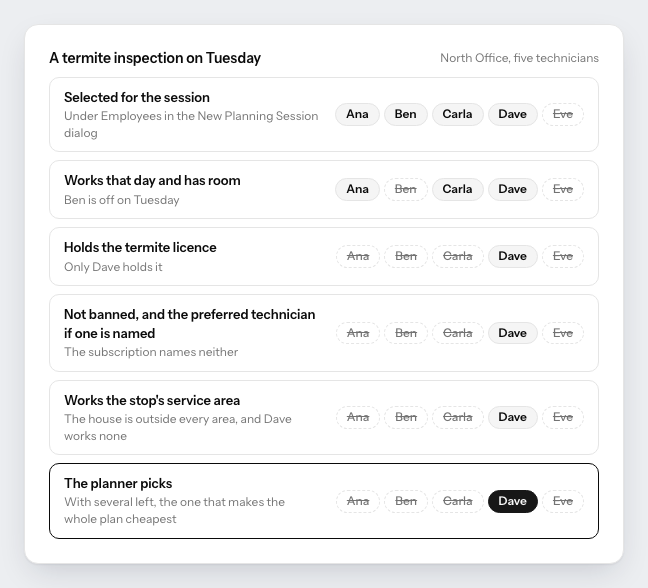
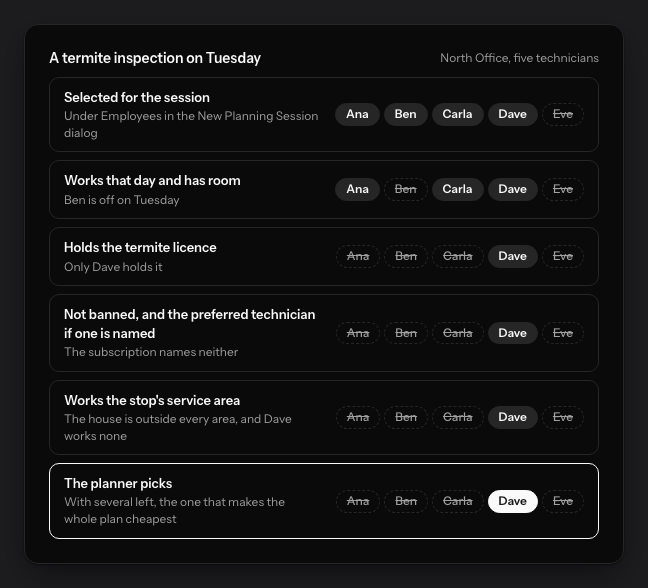
Example screen with demonstration data. - 3
What came upAug 2026
Two rules the first run could not know
The office pointed out a technician who only works one state, and the skills had never been entered in FieldRoutes. Neither was in the data, so neither was in the plan. That is what an audit is for.
PestRouting · Route audit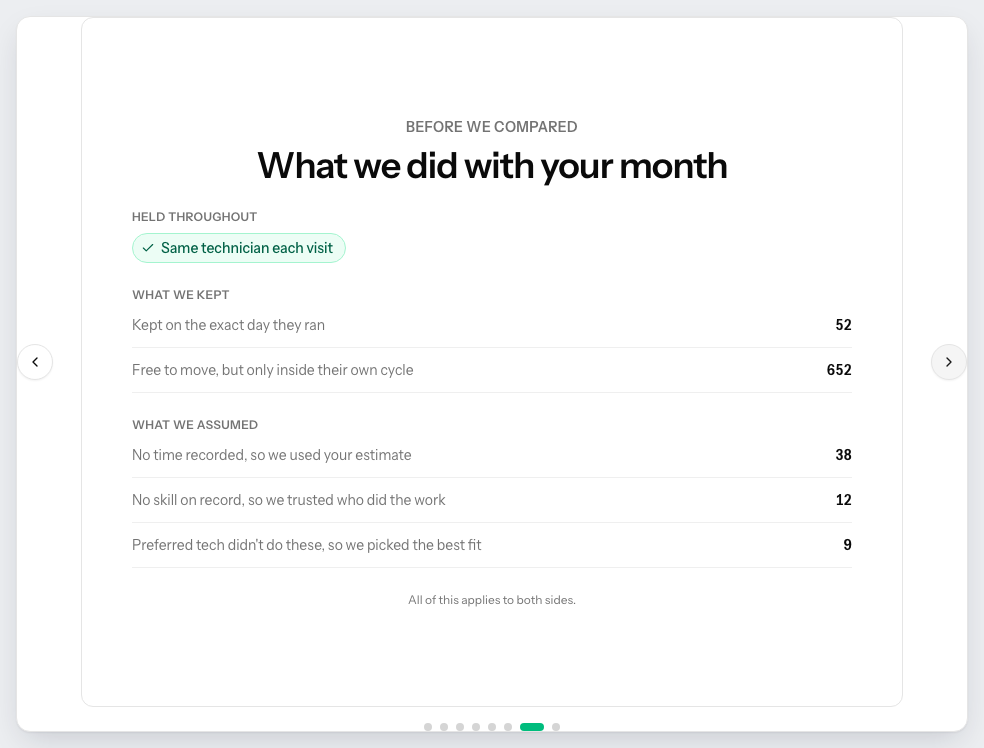
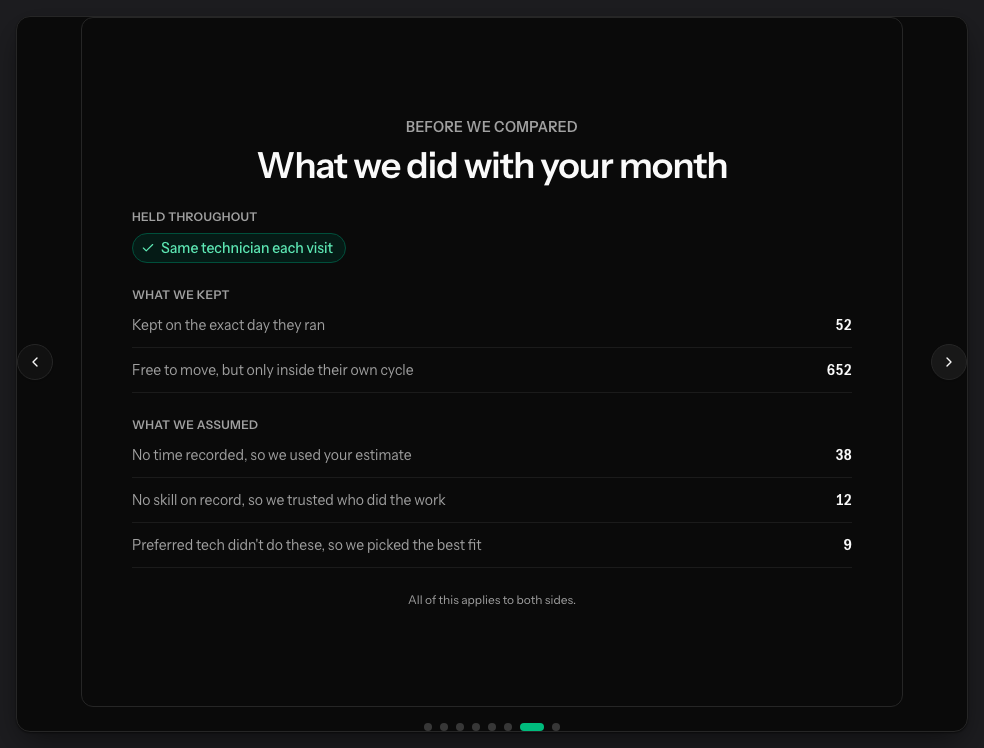
Example screen with demonstration data. - 4
Next
The current month, under the full rules
The office asked for the current month to be run next, with the one-state technician as a service area and the skills in place. Until then every figure here stays an audit figure.
This story is for you if
- Your technicians are paid on commission
- Customers belong to a technician by zip code
- Your area crosses state lines
The audit runs the same first step on one month of your own data.
Other operations, other briefs
- Early pilotCompletedSame team, same trucks, 49% more productionRules set by habit were capping a recurring route book. Keeping only the real promises changed how the whole fleet ran.Read this story
- Since Jul 2026CompletedFull, fair days for a production-paid teamThe cheapest plan emptied days. The plan they run keeps territories, and every technician within 5% of a fair share.Read this story
- Since Sep 2026In progress20% less drive time, and every route keptThe audit offered fewer routes and the owner said no. Shorter drives instead, every route kept, and a month planned in minutes.Read this story
- Behind every figureHow we measure every number we publishDistance per stop, drive time share and production per paid hour, and why each is a ratio.Read the performance benchmarks
Questions about this story
- What did this operation ask PestRouting for?
- Fuller routes with every customer kept by their technician: more production per route, so more pay per route, customers kept with the technician of their zip code, a technician who works only one state kept there, and the cost of a day counted from the first stop to the last.
- What did keeping preferred technicians cost?
- Five points. The same month planned without them came to 38% more production per route, with them 33%. The office chose to keep every customer with their technician.
- What happens to a technician who only works one state?
- They get a service area that covers that state, and the PestRouting planner never gives them a stop outside it.
Your office has its own story. Start it with one month.
30-minute intro call. We connect to FieldRoutes read-only, plan one real month of yours again under your rules and the goal you name, and walk you through the result. Nothing is written back.
Some audits come back saying your routes are already tight. You will hear that too.
Get Your Free Route Audit
A 30-minute intro call, a written report on what your routes are leaving on the table, and zero pressure to sign anything. We only follow up if you ask.
Book Your Free Analysis
Free analysis with no obligation
We'll analyze your current routes and show you the savings potential.
First call within 24 to 48 hours
Full analysis and written report typically ready within about a week.
Real people, start to finish
The people who build PestRouting run your audit and walk you through the results.
Risk-Free Opportunity
See exactly how much you could save before spending a dime.