Recurring route book · several technicians
Same team, same trucks. 49% more production.
The routes looked fine, but the team was capped. The owner wanted more work done by the people already on the payroll, without breaking a single promise a customer had really been given.
The goal from the first call
More production from the team already on the payroll.
What the customer asked for
- More work done without hiring
- Every real promise to a customer kept
- Proof in ratios, taken before and after
Measured after the new routes had run
- +49% Measured
- Production per work time
- No technician, truck or hour added.
- −23% Measured
- Miles per stop
- Across the whole fleet, not one good route.
- −15% Measured
- Drive time per route
- From a tighter order inside each day.
The rules that had to hold
What the plan was not allowed to break
Preferred times
Real promises stayed exactly as booked. Windows set by default could move within the day.
Preferred technicians
Real customer relationships stayed. Leftovers from old territories did not.
Preferred weekdays
Only the day locks the business really needed, because each one fixes every visit after it.
Step by step
From the first audit to a planned month
- 1
Measure
Start from what really happened
Miles per stop, drive time per route and production per work time, read from FieldRoutes before a single route moved. Ratios, so a busier month cannot pass for a worse one.
PestRouting · Field Operations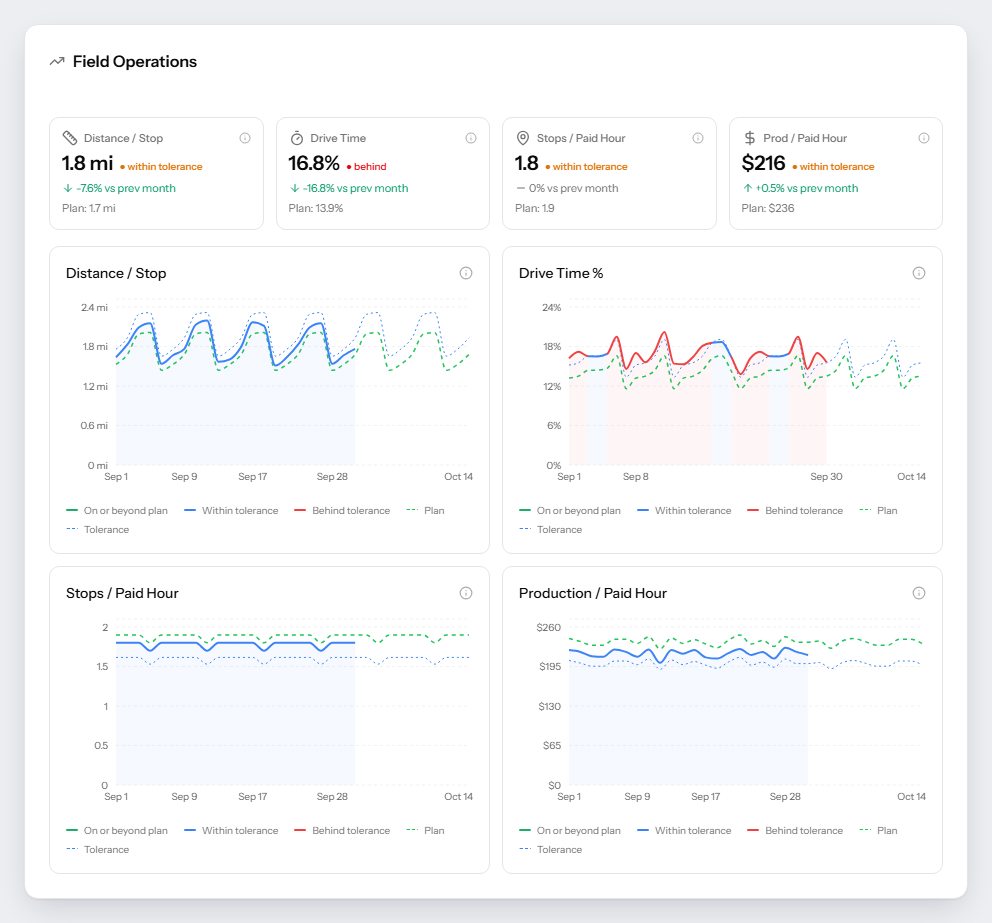
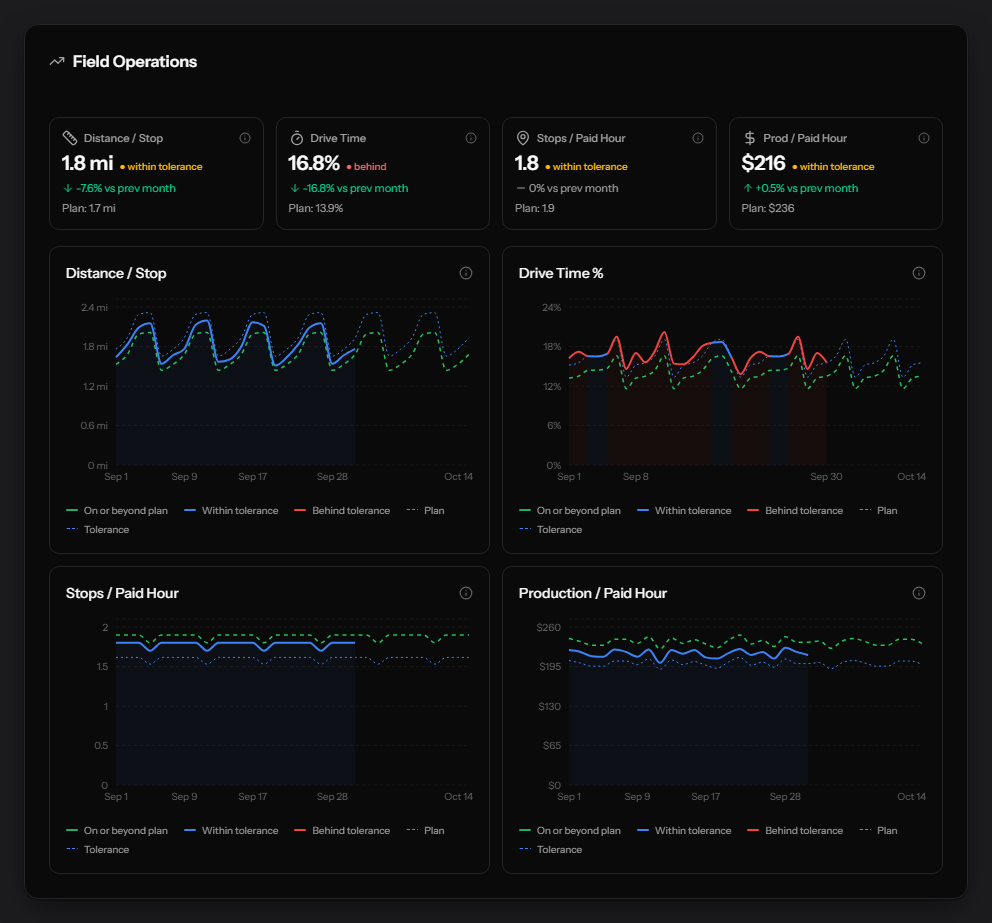
Example screen with demonstration data. - 2
Rule review
Sort the promises from the habits
Every time window, preferred technician and weekday lock went through one question: did a customer ask for this? Most had been set by default. Those were opened up, the real ones stayed.
PestRouting · How much may move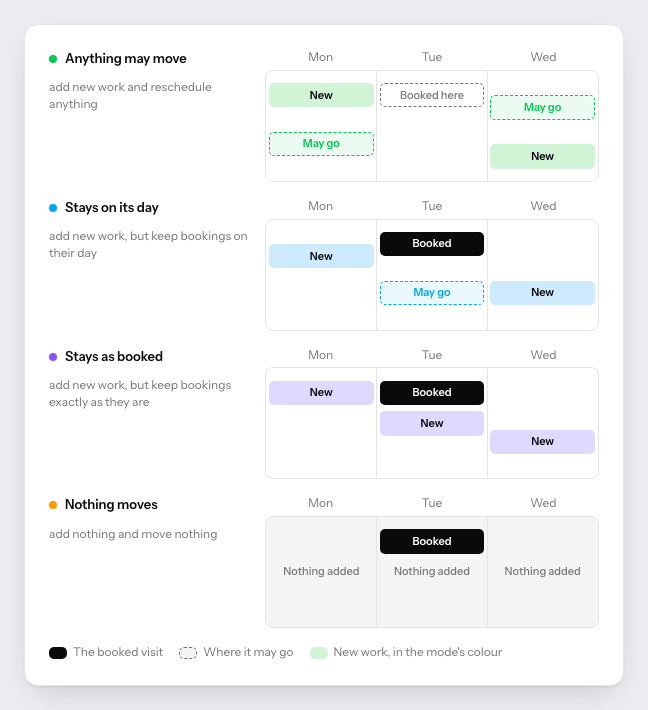
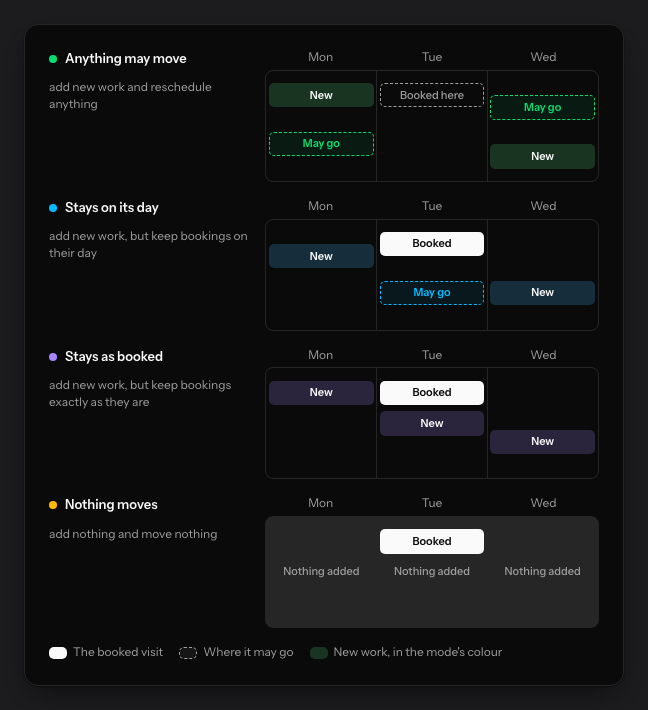
Example screen with demonstration data. - 3
Compare and adopt
See the ceiling, then pick the plan
A run without any rules showed what the habits were costing. Plans with only the real rules, one of them with a technician less, were compared on the same ratios. The owner picked one, and it went into FieldRoutes. Today that is a simulation and one adopt click.
PestRouting · Compare scenariosCompare scenarios
The month as it ran, against the plans the owner could pick from
Metric As it ranBaseline Real promises onlyPicked One technician less Miles per stop Baseline −23% Testednot taken Production per work time Baseline +49% Testednot taken Customer promises kept All All All A run with no rules at all came out higher still. It stayed a reference for what the habits cost, never a plan.
This story’s own figures, as measured after the chosen plan ran, drawn for this page. - 4
Measure again
Same ratios, after the routes ran
The gains showed up across the fleet, not in one technician having a good month. Same team, same territory, routes built around the promises that were real.
This story is for you if
- Your route book has grown for years without a clean-up
- Many time windows and preferred technicians were set by default
- You want more done by the team you already have
The audit runs the same first step on one month of your own data.
Other operations, other briefs
- Since Jul 2026CompletedFull, fair days for a production-paid teamThe cheapest plan emptied days. The plan they run keeps territories, and every technician within 5% of a fair share.Read this story
- Since Sep 2026In progress20% less drive time, and every route keptThe audit offered fewer routes and the owner said no. Shorter drives instead, every route kept, and a month planned in minutes.Read this story
- Since Aug 2026In progress33% more per route, every preferred technician keptTechnicians on commission across state lines. A fuller route is a better-paid one, and customers stay with the technician they know.Read this story
- Behind every figureHow we measure every number we publishDistance per stop, drive time share and production per paid hour, and why each is a ratio.Read the performance benchmarks
Questions about this story
- What did this operation ask PestRouting for?
- More production from the team already on the payroll, without hiring and without breaking a promise a customer had really been given, and proof in ratios taken before and after the new routes ran.
- Is 49% more production typical?
- No. It is the strongest result we have measured. The ranges PestRouting publishes from real operations are 15 to 40% more production, 15 to 30% fewer miles and 10 to 25% less drive time. Where you land depends on how many of your rules are habits rather than promises.
- Were customer promises broken to get there?
- No. Time windows, technicians and weekdays that customers had really been promised stayed in place. What changed were the defaults nobody had asked for.
- Why is the operation not named?
- Our customers have not agreed to be named, so each story describes the kind of operation, the rules and the steps instead. The figures are real and labelled by how they were found.
Your office has its own story. Start it with one month.
30-minute intro call. We connect to FieldRoutes read-only, plan one real month of yours again under your rules and the goal you name, and walk you through the result. Nothing is written back.
Some audits come back saying your routes are already tight. You will hear that too.
Get Your Free Route Audit
A 30-minute intro call, a written report on what your routes are leaving on the table, and zero pressure to sign anything. We only follow up if you ask.
Book Your Free Analysis
Free analysis with no obligation
We'll analyze your current routes and show you the savings potential.
First call within 24 to 48 hours
Full analysis and written report typically ready within about a week.
Real people, start to finish
The people who build PestRouting run your audit and walk you through the results.
Risk-Free Opportunity
See exactly how much you could save before spending a dime.